
- Start >
- Rivers >
- Waterlevel >
- Naab - Regen >
- Trausnitz u. d. Mühle >
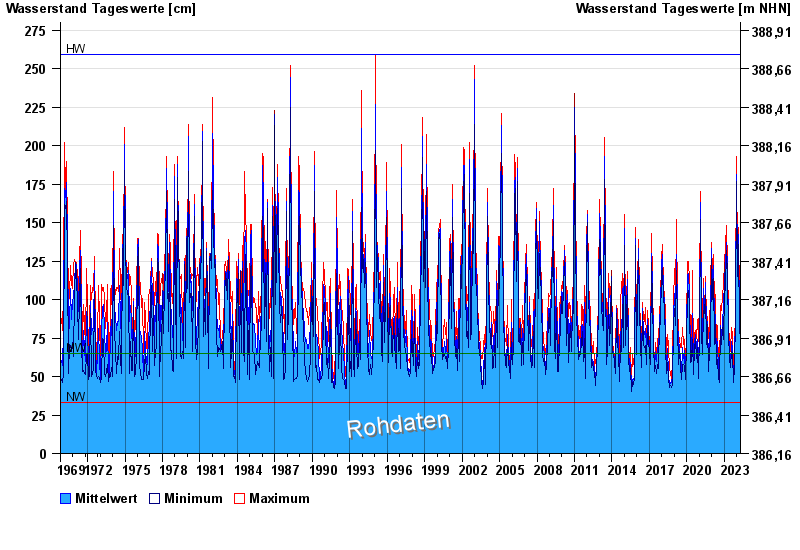
- Chart of total period

Chart of total period Trausnitz u. d. Mühle / Pfreimd
Waterlevel from 01.11.1969 to 18.04.2024
| Date | Mean value [cm] | Maximum [cm] | Minimum [cm] |
|---|---|---|---|
| 18.04.2024 | 77 | 79 | 75 |
| 17.04.2024 | 71 | 75 | 67 |
| 16.04.2024 | 65 | 68 | 64 |
| 15.04.2024 | 63 | 68 | 61 |
| 14.04.2024 | 61 | 61 | 60 |
| 13.04.2024 | 61 | 62 | 60 |
| 12.04.2024 | 62 | 63 | 60 |
© Bayerisches Landesamt für Umwelt 2024