
- Start >
- Rivers >
- Waterlevel >
- Naab - Regen >
- Ösbühl >
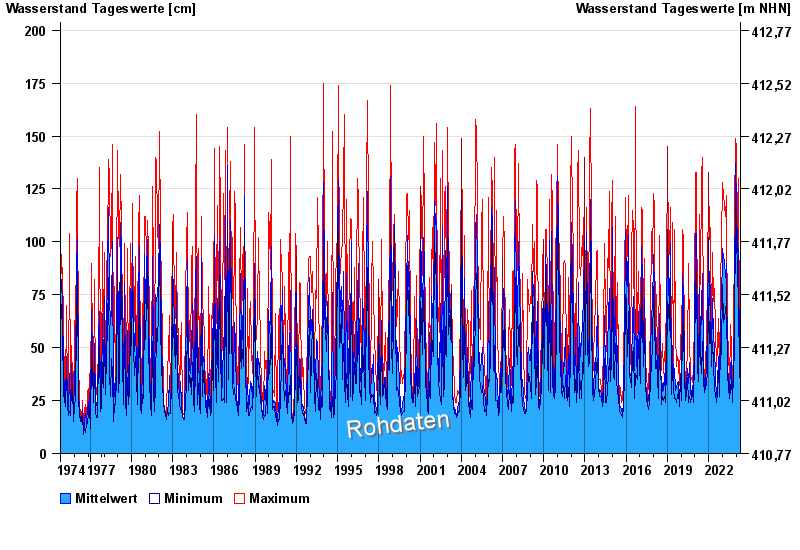
- Chart of total period

Chart of total period Ösbühl / Danglesbach
Waterlevel from 01.11.1974 to 26.04.2024
| Date | Mean value [cm] | Maximum [cm] | Minimum [cm] |
|---|---|---|---|
| 26.04.2024 | 42 | 42 | 41 |
| 25.04.2024 | 43 | 47 | 41 |
| 24.04.2024 | 42 | 43 | 41 |
| 23.04.2024 | 43 | 44 | 42 |
| 22.04.2024 | 47 | 50 | 44 |
| 21.04.2024 | 50 | 53 | 49 |
| 20.04.2024 | 70 | 97 | 52 |
© Bayerisches Landesamt für Umwelt 2024