
- Start >
- Rivers >
- Waterlevel >
- Naab - Regen >
- Ösbühl >
- Chart of total period

Chart of total period Ösbühl / Danglesbach
Waterlevel from 01.11.1974 to 20.04.2024
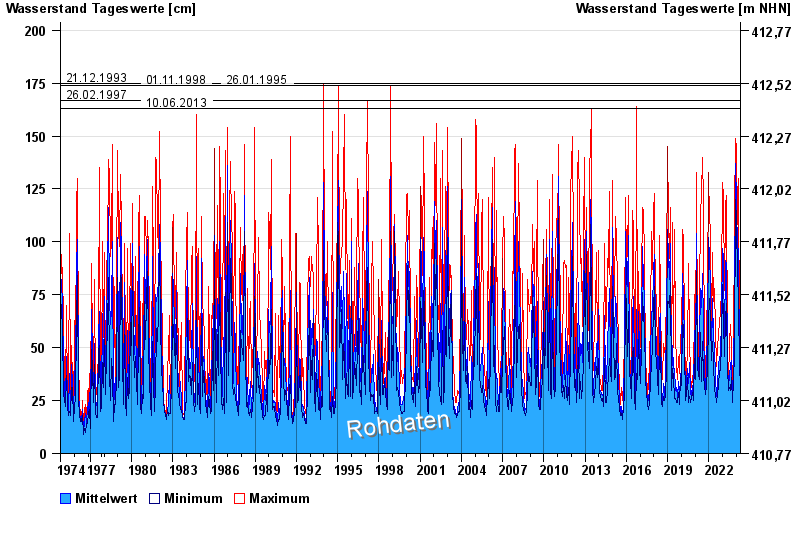
- 21.12.1993 Wasserstand: 175 cm
- 01.11.1998 Wasserstand: 174 cm
- 26.01.1995 Wasserstand: 174 cm
- 26.02.1997 Wasserstand: 167 cm
- 10.06.2013 Wasserstand: 163 cm
| Date | Mean value [cm] | Maximum [cm] | Minimum [cm] |
|---|---|---|---|
| 20.04.2024 | 84 | 97 | 78 |
| 19.04.2024 | 61 | 104 | 45 |
| 18.04.2024 | 63 | 80 | 46 |
| 17.04.2024 | 39 | 45 | 36 |
| 16.04.2024 | 36 | 42 | 32 |
| 15.04.2024 | 33 | 35 | 31 |
| 14.04.2024 | 31 | 33 | 30 |
© Bayerisches Landesamt für Umwelt 2024