
- Start >
- Rivers >
- Waterlevel >
- Naab - Regen >
- Lohma >
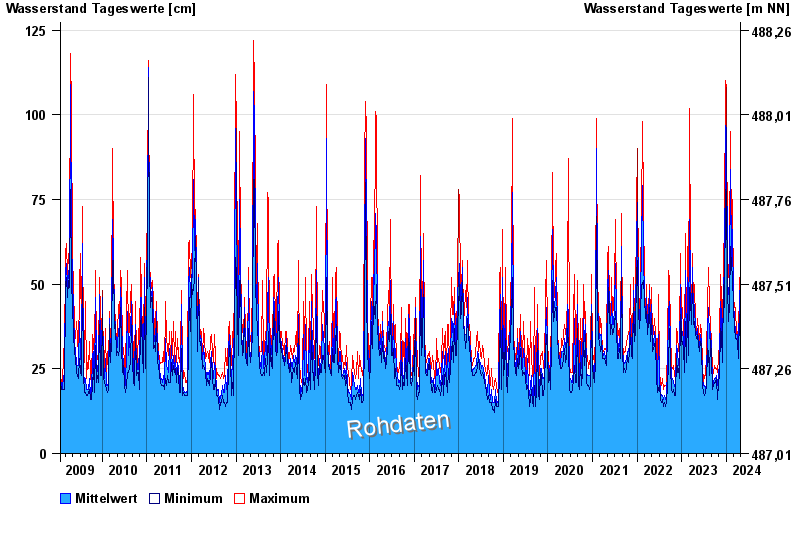
- Chart of total period

Chart of total period Lohma / Zottbach
Waterlevel from 22.01.2009 to 26.04.2024
 Für diesen Pegel sind keine Meldestufen hinterlegt.
| Date | Mean value [cm] | Maximum [cm] | Minimum [cm] |
|---|---|---|---|
| 26.04.2024 | 34 | 34 | 34 |
| 25.04.2024 | 33 | 34 | 33 |
| 24.04.2024 | 34 | 35 | 33 |
| 23.04.2024 | 36 | 38 | 34 |
| 22.04.2024 | 40 | 43 | 36 |
| 21.04.2024 | 42 | 46 | 40 |
| 20.04.2024 | 48 | 52 | 41 |
© Bayerisches Landesamt für Umwelt 2024