
- Start >
- Rivers >
- Waterlevel >
- Naab - Regen >
- Lohma >
- Chart of total period

Chart of total period Lohma / Zottbach
Waterlevel from 22.01.2009 to 18.04.2024
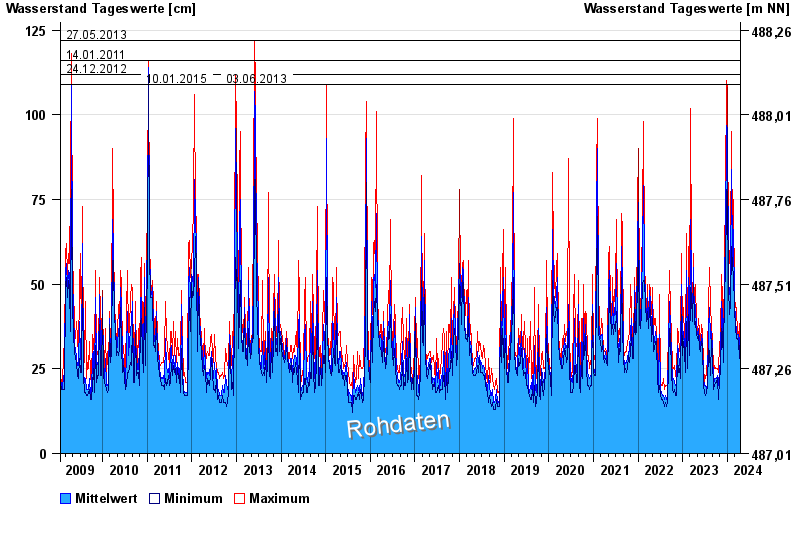
- 27.05.2013 Wasserstand: 122 cm
- 14.01.2011 Wasserstand: 116 cm
- 24.12.2012 Wasserstand: 112 cm
- 10.01.2015 Wasserstand: 109 cm
- 03.06.2013 Wasserstand: 109 cm
| Date | Mean value [cm] | Maximum [cm] | Minimum [cm] |
|---|---|---|---|
| 18.04.2024 | 35 | 37 | 34 |
| 17.04.2024 | 40 | 45 | 36 |
| 16.04.2024 | 32 | 36 | 30 |
| 15.04.2024 | 30 | 32 | 27 |
| 14.04.2024 | 28 | 29 | 27 |
| 13.04.2024 | 29 | 29 | 27 |
| 12.04.2024 | 29 | 29 | 27 |
© Bayerisches Landesamt für Umwelt 2024