
- Start >
- Rivers >
- Waterlevel >
- Naab - Regen >
- Hahnbach >
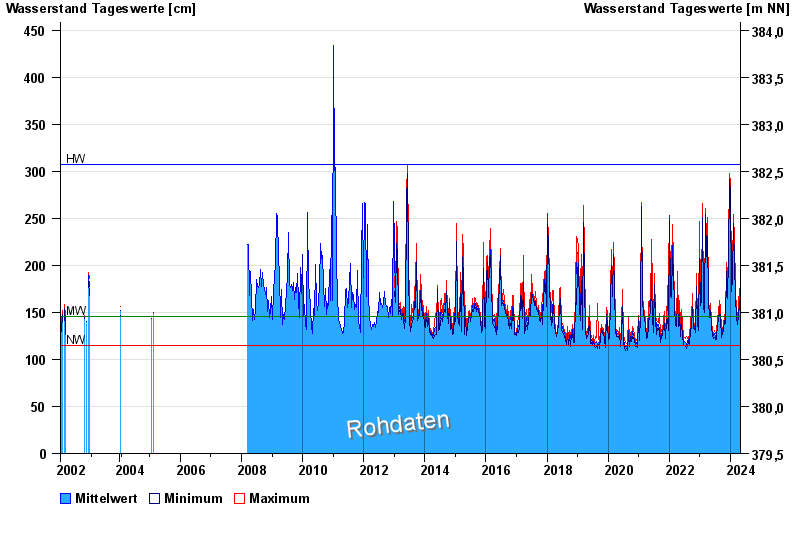
- Chart of total period

Chart of total period Hahnbach / Vils
Waterlevel from 28.01.2002 to 30.04.2024
| Date | Mean value [cm] | Maximum [cm] | Minimum [cm] |
|---|---|---|---|
| 30.04.2024 | 134 | 135 | 132 |
| 29.04.2024 | 135 | 138 | 132 |
| 28.04.2024 | 138 | 141 | 135 |
| 27.04.2024 | 142 | 144 | 139 |
| 26.04.2024 | 145 | 148 | 143 |
| 25.04.2024 | 146 | 147 | 145 |
| 24.04.2024 | 149 | 153 | 145 |
© Bayerisches Landesamt für Umwelt 2024