
- Start >
- Rivers >
- Waterlevel >
- Naab - Regen >
- Hahnbach >
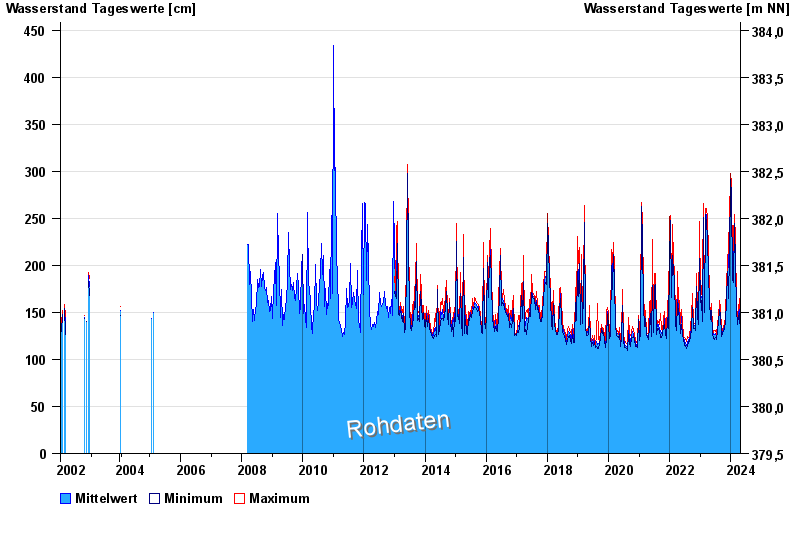
- Chart of total period

Chart of total period Hahnbach / Vils
Waterlevel from 28.01.2002 to 25.04.2024
| Date | Mean value [cm] | Maximum [cm] | Minimum [cm] |
|---|---|---|---|
| 25.04.2024 | 146 | 147 | 145 |
| 24.04.2024 | 149 | 153 | 145 |
| 23.04.2024 | 158 | 165 | 151 |
| 22.04.2024 | 167 | 175 | 161 |
| 21.04.2024 | 165 | 174 | 158 |
| 20.04.2024 | 161 | 166 | 155 |
| 19.04.2024 | 142 | 154 | 138 |
© Bayerisches Landesamt für Umwelt 2024