
- Start >
- Rivers >
- Waterlevel >
- Naab - Regen >
- Fronhof >
- Chart of total period

Chart of total period Fronhof / Murach
Waterlevel from 01.11.1969 to 26.04.2024
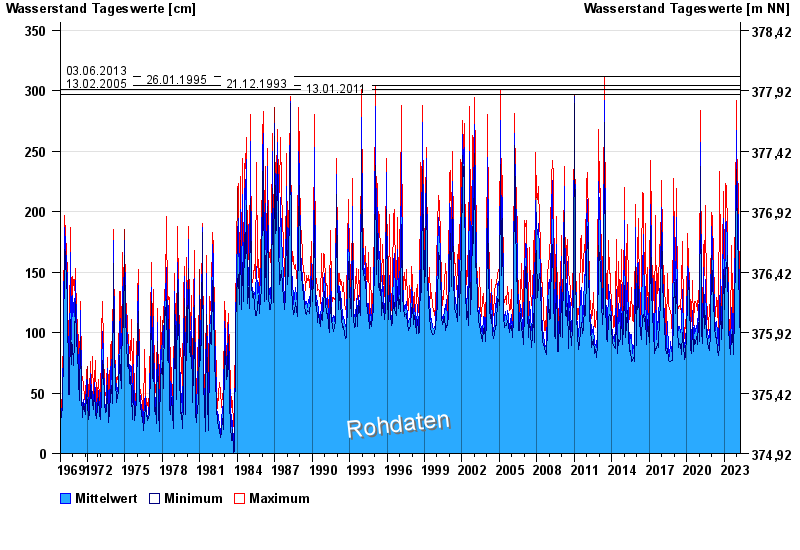
- 03.06.2013 Wasserstand: 312 cm
- 26.01.1995 Wasserstand: 304 cm
- 13.02.2005 Wasserstand: 301 cm
- 21.12.1993 Wasserstand: 301 cm
- 13.01.2011 Wasserstand: 297 cm
| Date | Mean value [cm] | Maximum [cm] | Minimum [cm] |
|---|---|---|---|
| 26.04.2024 | 105 | 111 | 100 |
| 25.04.2024 | 107 | 112 | 104 |
| 24.04.2024 | 107 | 110 | 104 |
| 23.04.2024 | 109 | 114 | 106 |
| 22.04.2024 | 118 | 127 | 113 |
| 21.04.2024 | 125 | 135 | 115 |
| 20.04.2024 | 141 | 158 | 125 |
© Bayerisches Landesamt für Umwelt 2024