
- Start >
- Rivers >
- Waterlevel >
- Naab - Regen >
- Fronhof >
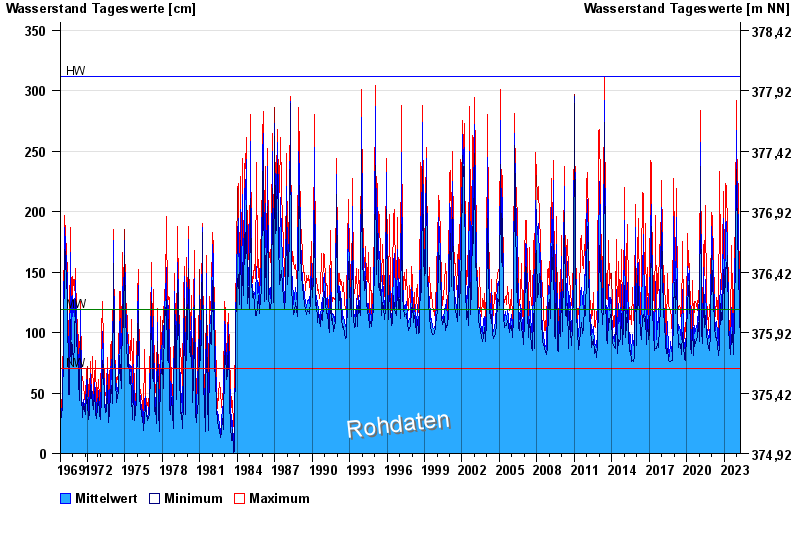
- Chart of total period

Chart of total period Fronhof / Murach
Waterlevel from 01.11.1969 to 24.04.2024
| Date | Mean value [cm] | Maximum [cm] | Minimum [cm] |
|---|---|---|---|
| 24.04.2024 | 108 | 110 | 107 |
| 23.04.2024 | 109 | 114 | 106 |
| 22.04.2024 | 118 | 127 | 113 |
| 21.04.2024 | 125 | 135 | 115 |
| 20.04.2024 | 141 | 158 | 125 |
| 19.04.2024 | 111 | 138 | 102 |
| 18.04.2024 | 109 | 119 | 102 |
© Bayerisches Landesamt für Umwelt 2024