
- Start >
- Rivers >
- Waterlevel >
- Unterer Main >
- Hafenlohr >
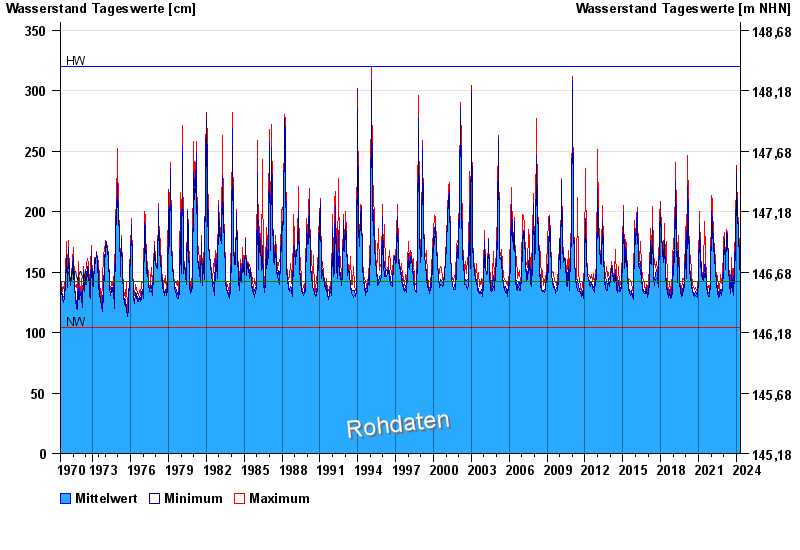
- Chart of total period

Chart of total period Hafenlohr / Hafenlohr
Waterlevel from 15.06.1970 to 26.04.2024
| Date | Mean value [cm] | Maximum [cm] | Minimum [cm] |
|---|---|---|---|
| 26.04.2024 | 165 | 167 | 164 |
| 25.04.2024 | 167 | 169 | 166 |
| 24.04.2024 | 166 | 167 | 164 |
| 23.04.2024 | 165 | 166 | 164 |
| 22.04.2024 | 164 | 167 | 163 |
| 21.04.2024 | 164 | 168 | 160 |
| 20.04.2024 | 163 | 172 | 160 |
© Bayerisches Landesamt für Umwelt 2024