
- Start >
- Rivers >
- Waterlevel >
- Unterer Main >
- Hafenlohr >
- Chart of total period

Chart of total period Hafenlohr / Hafenlohr
Waterlevel from 15.06.1970 to 19.04.2024
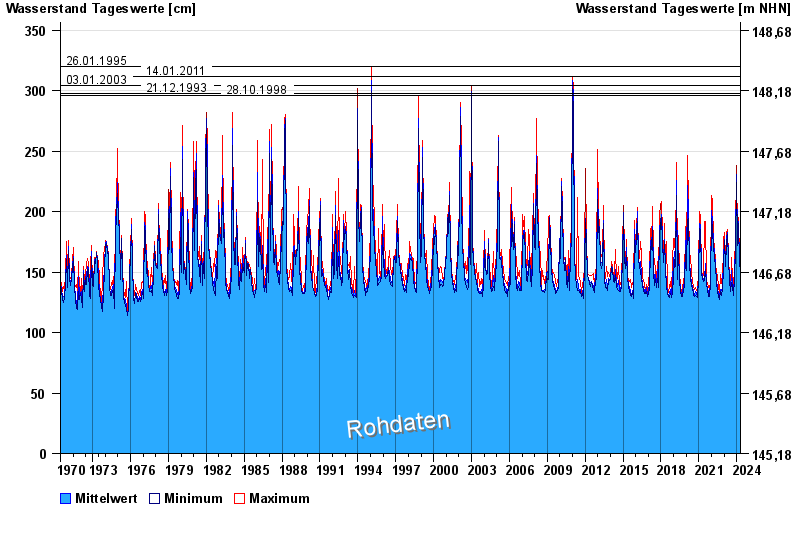
- 26.01.1995 Wasserstand: 320 cm
- 14.01.2011 Wasserstand: 312 cm
- 03.01.2003 Wasserstand: 304 cm
- 21.12.1993 Wasserstand: 298 cm
- 28.10.1998 Wasserstand: 296 cm
| Date | Mean value [cm] | Maximum [cm] | Minimum [cm] |
|---|---|---|---|
| 19.04.2024 | 156 | 174 | 149 |
| 18.04.2024 | 151 | 152 | 149 |
| 17.04.2024 | 153 | 159 | 151 |
| 16.04.2024 | 153 | 161 | 151 |
| 15.04.2024 | 150 | 151 | 149 |
| 14.04.2024 | 149 | 150 | 148 |
| 13.04.2024 | 148 | 149 | 148 |
© Bayerisches Landesamt für Umwelt 2024