
- Start >
- Rivers >
- Waterlevel >
- Unterer Main >
- Birkenfeld >
- Chart of total period

Chart of total period Birkenfeld / Aisch
Waterlevel from 08.06.1994 to 26.04.2024
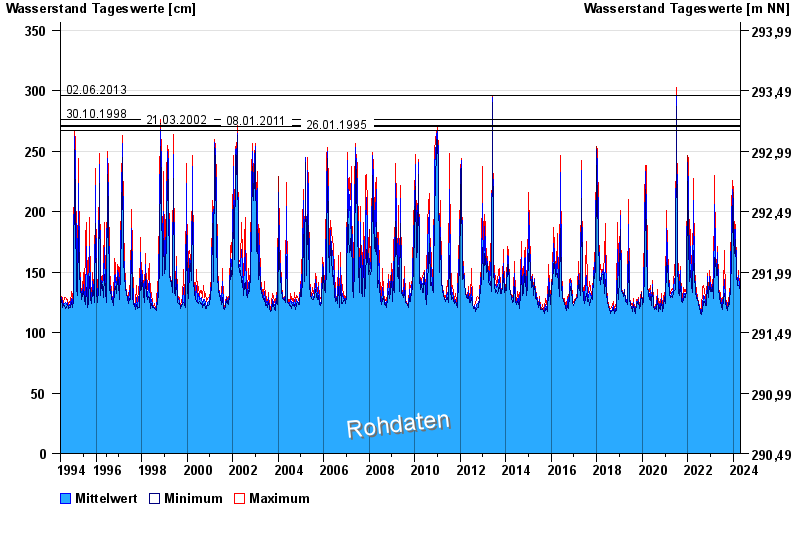
- 02.06.2013 Wasserstand: 296 cm
- 30.10.1998 Wasserstand: 276 cm
- 21.03.2002 Wasserstand: 271 cm
- 08.01.2011 Wasserstand: 270 cm
- 26.01.1995 Wasserstand: 267 cm
| Date | Mean value [cm] | Maximum [cm] | Minimum [cm] |
|---|---|---|---|
| 26.04.2024 | 132 | 132 | 132 |
| 25.04.2024 | 132 | 133 | 132 |
| 24.04.2024 | 133 | 134 | 133 |
| 23.04.2024 | 134 | 135 | 134 |
| 22.04.2024 | 136 | 137 | 135 |
| 21.04.2024 | 134 | 136 | 134 |
| 20.04.2024 | 136 | 137 | 135 |
© Bayerisches Landesamt für Umwelt 2024