
- Start >
- Rivers >
- Waterlevel >
- Unterer Main >
- Birkenfeld >
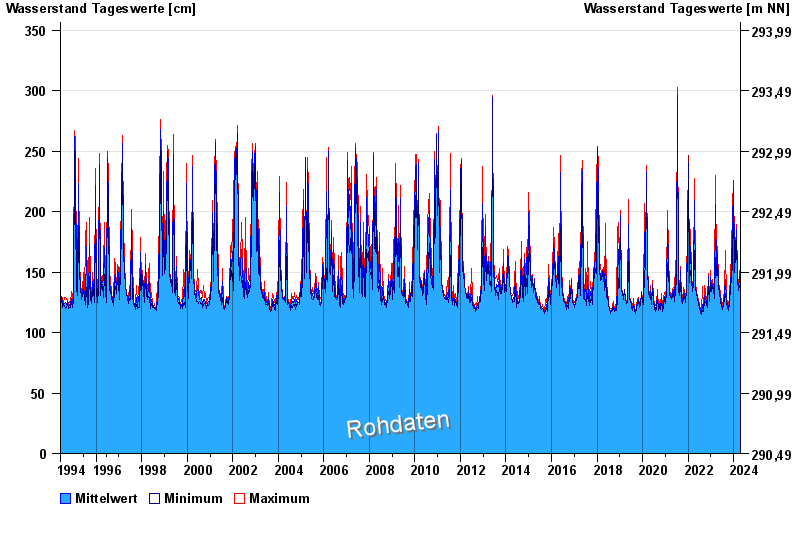
- Chart of total period

Chart of total period Birkenfeld / Aisch
Waterlevel from 08.06.1994 to 20.04.2024
| Date | Mean value [cm] | Maximum [cm] | Minimum [cm] |
|---|---|---|---|
| 20.04.2024 | 137 | 137 | 137 |
| 19.04.2024 | 134 | 139 | 132 |
| 18.04.2024 | 133 | 134 | 131 |
| 17.04.2024 | 135 | 135 | 134 |
| 16.04.2024 | 132 | 134 | 131 |
| 15.04.2024 | 130 | 131 | 130 |
| 14.04.2024 | 130 | 130 | 130 |
© Bayerisches Landesamt für Umwelt 2024