
- Start >
- Rivers >
- Waterlevel >
- Obere Donau >
- Rödenweiler >
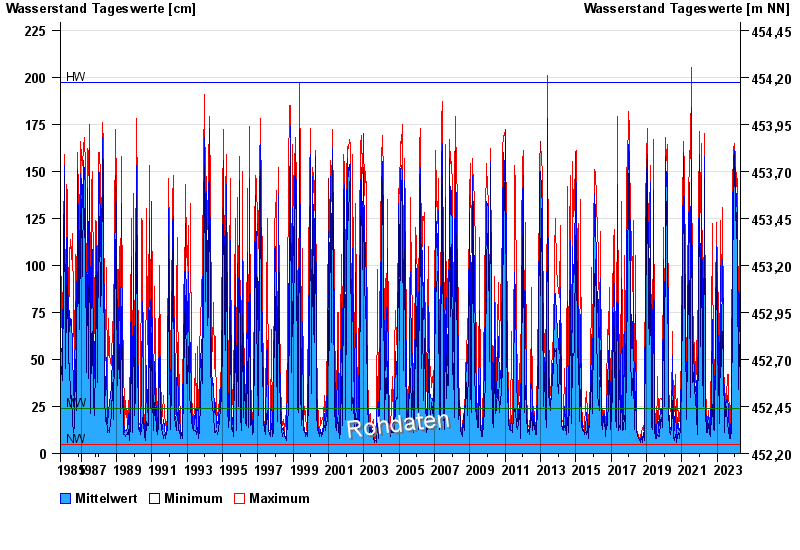
- Chart of total period

Chart of total period Rödenweiler / Sulzach
Waterlevel from 01.11.1985 to 26.04.2024
note
Wasserstand und Abfluss wird zeitweise durch Biberdamm beeinflusst.
| Date | Mean value [cm] | Maximum [cm] | Minimum [cm] |
|---|---|---|---|
| 26.04.2024 | 23 | 23 | 22 |
| 25.04.2024 | 23 | 24 | 22 |
| 24.04.2024 | 23 | 26 | 22 |
| 23.04.2024 | 32 | 40 | 26 |
| 22.04.2024 | 52 | 66 | 40 |
| 21.04.2024 | 56 | 71 | 37 |
| 20.04.2024 | 50 | 54 | 40 |
© Bayerisches Landesamt für Umwelt 2024