
- Start >
- Rivers >
- Waterlevel >
- Obere Donau >
- Rödenweiler >
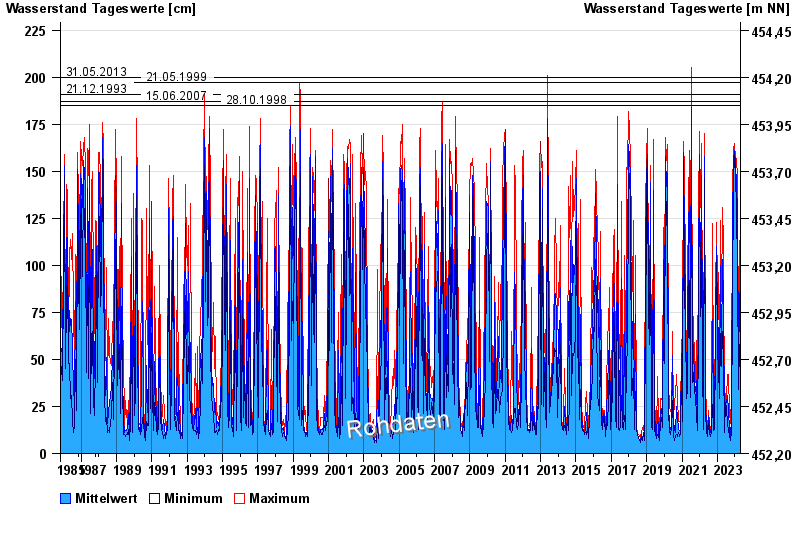
- Chart of total period

Chart of total period Rödenweiler / Sulzach
Waterlevel from 01.11.1985 to 23.04.2024
note
Wasserstand und Abfluss wird zeitweise durch Biberdamm beeinflusst.
- 31.05.2013 Wasserstand: 200 cm
- 21.05.1999 Wasserstand: 197 cm
- 21.12.1993 Wasserstand: 191 cm
- 15.06.2007 Wasserstand: 187 cm
- 28.10.1998 Wasserstand: 185 cm
| Date | Mean value [cm] | Maximum [cm] | Minimum [cm] |
|---|---|---|---|
| 23.04.2024 | 35 | 40 | 31 |
| 22.04.2024 | 52 | 66 | 40 |
| 21.04.2024 | 56 | 71 | 37 |
| 20.04.2024 | 50 | 54 | 40 |
| 19.04.2024 | 22 | 51 | 13 |
| 18.04.2024 | 16 | 20 | 14 |
| 17.04.2024 | 23 | 25 | 19 |
© Bayerisches Landesamt für Umwelt 2024