
- Start >
- Rivers >
- Waterlevel >
- Obere Donau >
- Rasch >
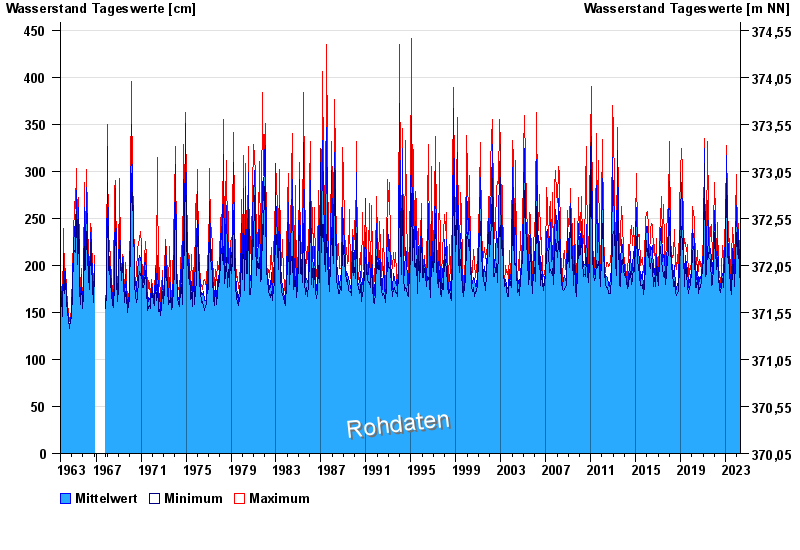
- Chart of total period

Chart of total period Rasch / Schwarzach
Waterlevel from 01.11.1963 to 26.04.2024
| Date | Mean value [cm] | Maximum [cm] | Minimum [cm] |
|---|---|---|---|
| 26.04.2024 | 188 | 189 | 188 |
| 25.04.2024 | 190 | 192 | 189 |
| 24.04.2024 | 191 | 192 | 190 |
| 23.04.2024 | 195 | 197 | 192 |
| 22.04.2024 | 204 | 214 | 198 |
| 21.04.2024 | 212 | 217 | 201 |
| 20.04.2024 | 205 | 220 | 198 |
© Bayerisches Landesamt für Umwelt 2024