
- Start >
- Rivers >
- Waterlevel >
- Obere Donau >
- Heitzenhofen >
- Chart of total period

Chart of total period Heitzenhofen / Naab
Waterlevel from 01.11.1963 to 26.04.2024
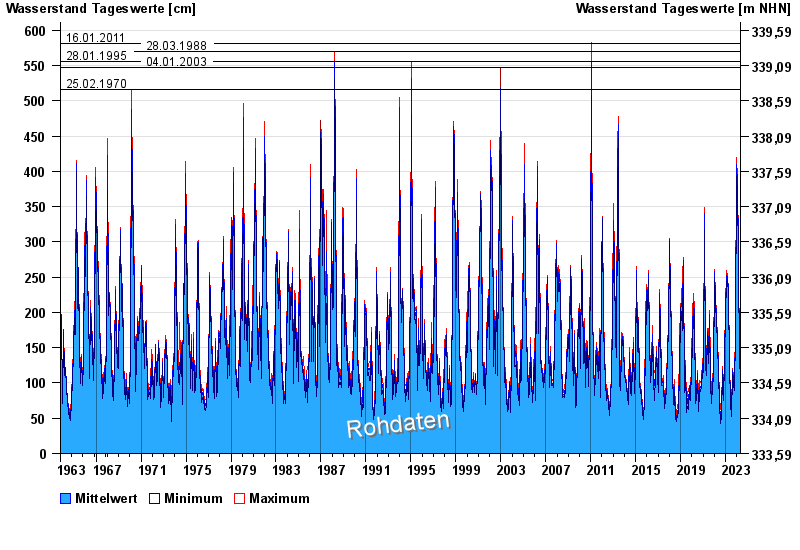
- 16.01.2011 Wasserstand: 581 cm
- 28.03.1988 Wasserstand: 570 cm
- 28.01.1995 Wasserstand: 555 cm
- 04.01.2003 Wasserstand: 547 cm
- 25.02.1970 Wasserstand: 516 cm
| Date | Mean value [cm] | Maximum [cm] | Minimum [cm] |
|---|---|---|---|
| 26.04.2024 | 121 | 124 | 117 |
| 25.04.2024 | 129 | 136 | 124 |
| 24.04.2024 | 143 | 150 | 136 |
| 23.04.2024 | 152 | 160 | 149 |
| 22.04.2024 | 159 | 162 | 155 |
| 21.04.2024 | 145 | 155 | 133 |
| 20.04.2024 | 119 | 133 | 110 |
© Bayerisches Landesamt für Umwelt 2024