
- Start >
- Rivers >
- Suspended sediment >
- Obere Donau >
- Heitzenhofen >
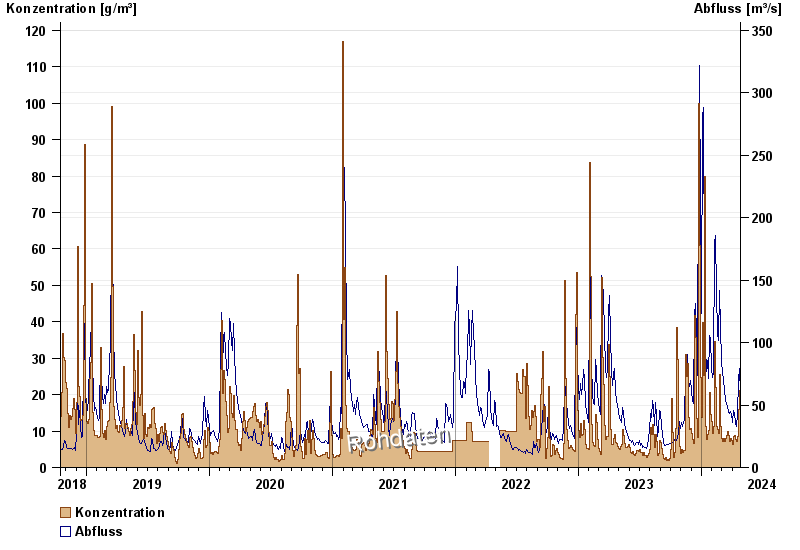
- Chart of total period

Chart of total period Heitzenhofen / Naab
Suspended sediment from 16.10.2018 to 25.04.2024
| Date | concentration [g/m³] | Runoff [m³/s] |
|---|---|---|
| 25.04.2024 | 12.4 | 59.1 |
| 24.04.2024 | 15.4 | 68.1 |
| 23.04.2024 | 18.4 | 74.5 |
| 22.04.2024 | 21.1 | 79.4 |
| 21.04.2024 | 15.8 | 69.4 |
| 20.04.2024 | 9.5 | 52.3 |
| 19.04.2024 | 8.9 | 45.1 |
© Bayerisches Landesamt für Umwelt 2024