
- Start >
- Rivers >
- Waterlevel >
- Obere Donau >
- Druisheim >
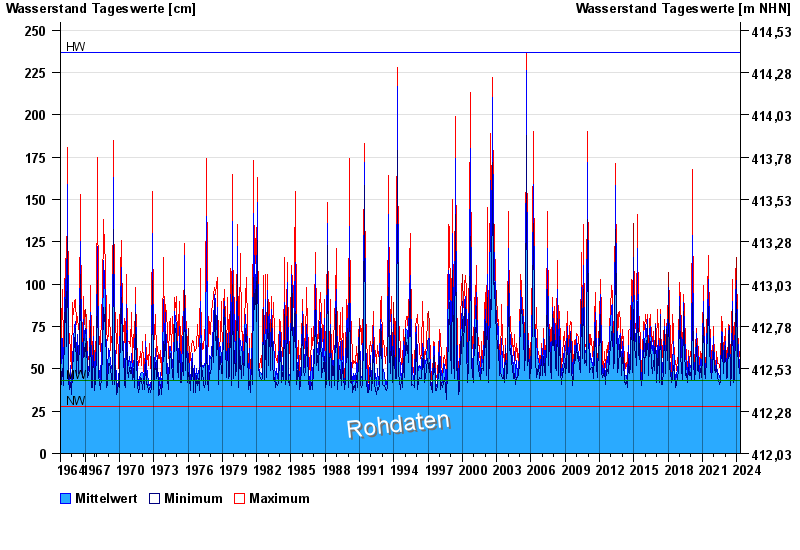
- Chart of total period

Chart of total period Druisheim / Schmutter
Waterlevel from 01.11.1964 to 01.05.2024
| Date | Mean value [cm] | Maximum [cm] | Minimum [cm] |
|---|---|---|---|
| 01.05.2024 | 43 | 44 | 41 |
| 30.04.2024 | 43 | 44 | 39 |
| 29.04.2024 | 43 | 45 | 40 |
| 28.04.2024 | 43 | 45 | 41 |
| 27.04.2024 | 44 | 48 | 42 |
| 26.04.2024 | 45 | 48 | 42 |
| 25.04.2024 | 45 | 47 | 42 |
© Bayerisches Landesamt für Umwelt 2024