
- Start >
- Rivers >
- Waterlevel >
- Obere Donau >
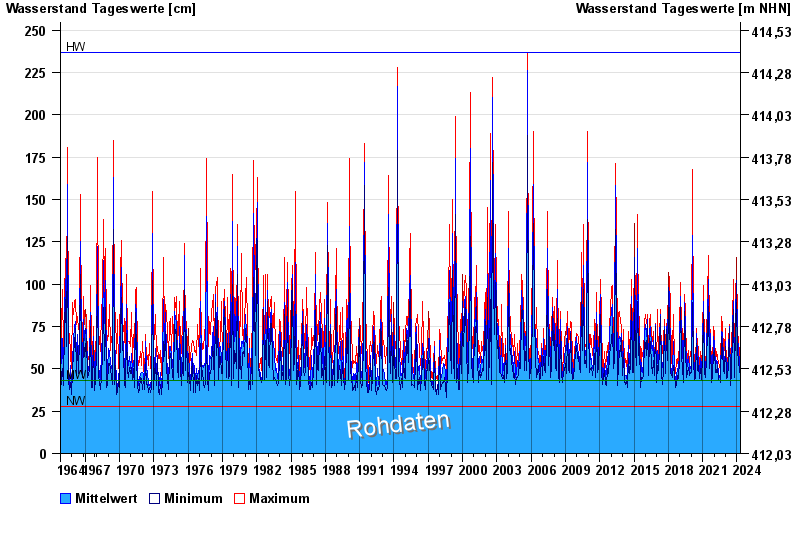
- Druisheim >
- Chart of total period

Chart of total period Druisheim / Schmutter
Waterlevel from 01.11.1964 to 23.04.2024
| Date | Mean value [cm] | Maximum [cm] | Minimum [cm] |
|---|---|---|---|
| 23.04.2024 | 48 | 48 | 45 |
| 22.04.2024 | 50 | 54 | 48 |
| 21.04.2024 | 49 | 55 | 48 |
| 20.04.2024 | 50 | 56 | 48 |
| 19.04.2024 | 48 | 54 | 43 |
| 18.04.2024 | 48 | 51 | 45 |
| 17.04.2024 | 48 | 50 | 44 |
© Bayerisches Landesamt für Umwelt 2024