
- Start >
- Rivers >
- Waterlevel >
- Obere Donau >
- Bergkirchen >
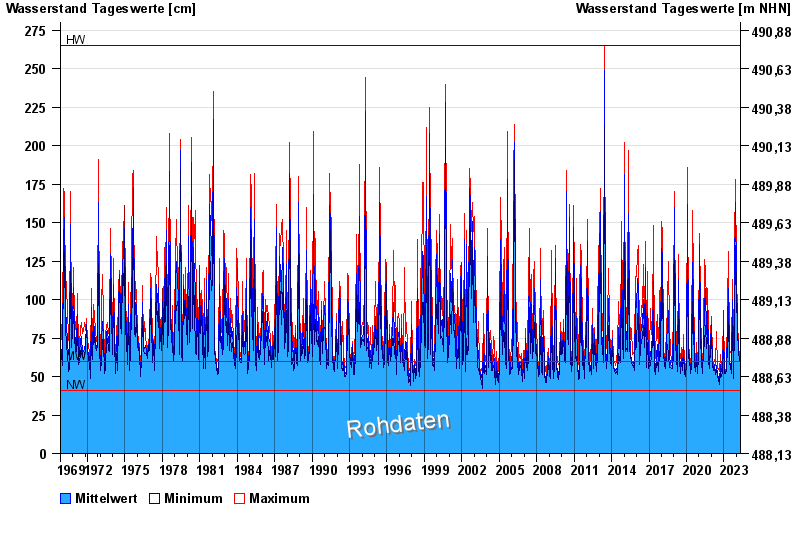
- Chart of total period

Chart of total period Bergkirchen / Maisach
Waterlevel from 01.11.1969 to 01.05.2024
| Date | Mean value [cm] | Maximum [cm] | Minimum [cm] |
|---|---|---|---|
| 01.05.2024 | 53 | 55 | 52 |
| 30.04.2024 | 53 | 55 | 51 |
| 29.04.2024 | 55 | 59 | 53 |
| 28.04.2024 | 56 | 56 | 56 |
| 27.04.2024 | 56 | 57 | 56 |
| 26.04.2024 | 56 | 57 | 54 |
| 25.04.2024 | 55 | 55 | 54 |
© Bayerisches Landesamt für Umwelt 2024