
- Start >
- Rivers >
- Waterlevel >
- Obere Donau >
- Bergkirchen >
- Chart of total period

Chart of total period Bergkirchen / Maisach
Waterlevel from 01.11.1969 to 18.04.2024
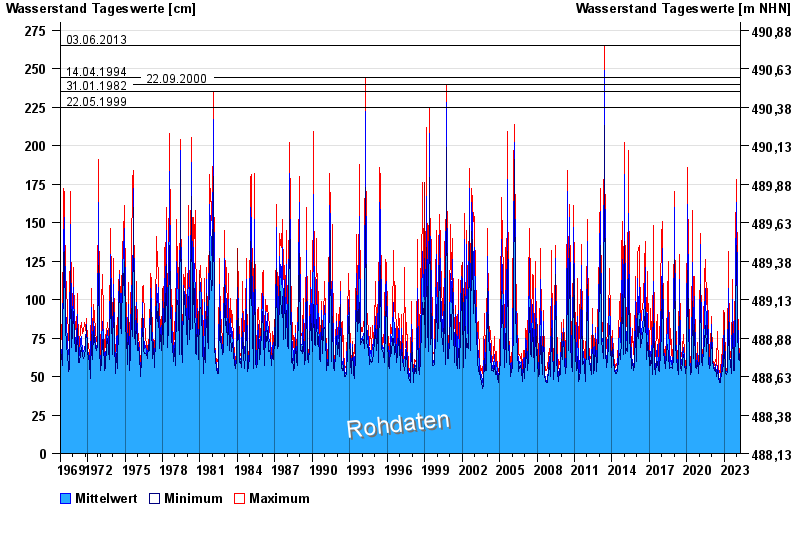
- 03.06.2013 Wasserstand: 265 cm
- 14.04.1994 Wasserstand: 244 cm
- 22.09.2000 Wasserstand: 240 cm
- 31.01.1982 Wasserstand: 235 cm
- 22.05.1999 Wasserstand: 225 cm
| Date | Mean value [cm] | Maximum [cm] | Minimum [cm] |
|---|---|---|---|
| 18.04.2024 | 56 | 57 | 56 |
| 17.04.2024 | 55 | 56 | 54 |
| 16.04.2024 | 55 | 56 | 54 |
| 15.04.2024 | 54 | 56 | 52 |
| 14.04.2024 | 53 | 54 | 52 |
| 13.04.2024 | 53 | 54 | 53 |
| 12.04.2024 | 54 | 54 | 53 |
© Bayerisches Landesamt für Umwelt 2024