
- Start >
- Rivers >
- Waterlevel >
- Obere Donau >
- Beilngries oberh. der Sulz >
- Chart of year

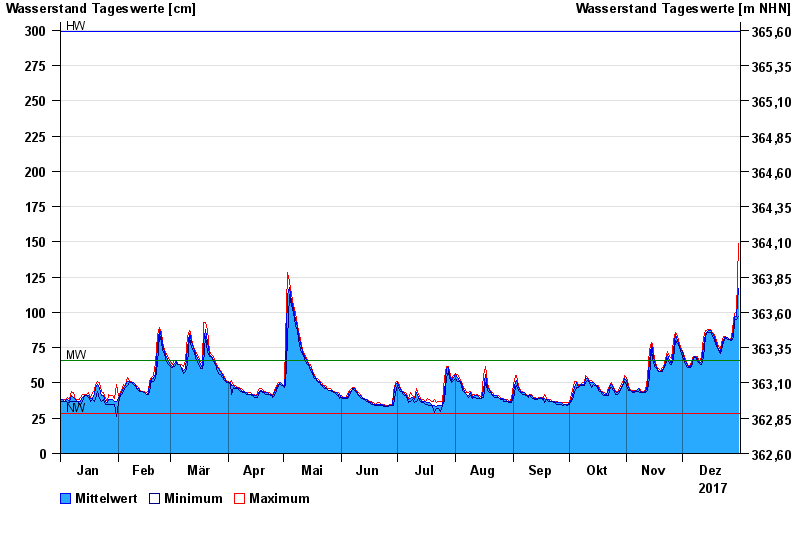
Chart of year Beilngries oberh. der Sulz / Altmühl
Waterlevel from 01.01.2017 to 31.12.2017
| Date | Mean value [cm] | Maximum [cm] | Minimum [cm] |
|---|---|---|---|
| 31.12.2017 | 117 | 149 | 97 |
| 30.12.2017 | 97 | 100 | 95 |
| 29.12.2017 | 97 | 99 | 94 |
| 28.12.2017 | 87 | 94 | 82 |
| 27.12.2017 | 81 | 82 | 80 |
| 26.12.2017 | 81 | 81 | 81 |
| 25.12.2017 | 82 | 82 | 81 |
© Bayerisches Landesamt für Umwelt 2024