
- Startseite >
- Flüsse >
- Wasserstand >
- Obere Donau >
- Beilngries oberh. der Sulz >
- Jahresgrafik

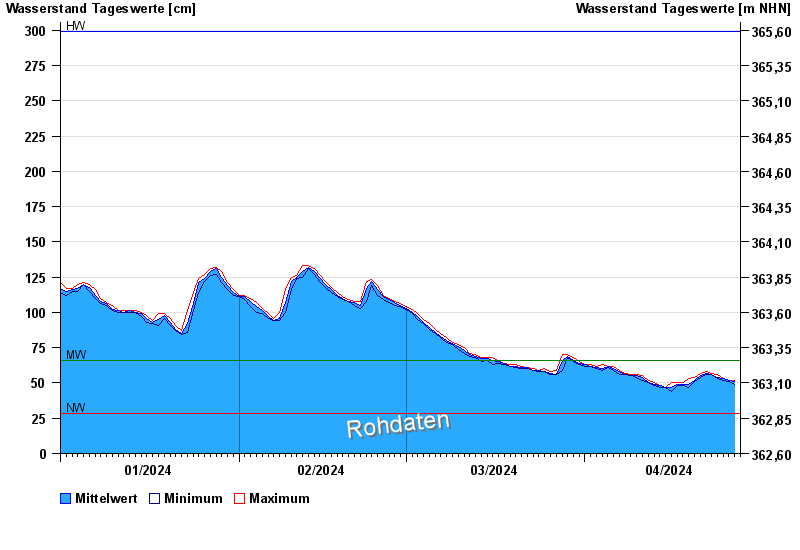
Jahresgrafik Beilngries oberh. der Sulz / Altmühl
Wasserstand vom 01.01.2024 bis zum 27.04.2024
| Datum | Mittelwert [cm] | Maximum [cm] | Minimum [cm] |
|---|---|---|---|
| 27.04.2024 | 52 | 52 | 52 |
| 26.04.2024 | 52 | 52 | 51 |
| 25.04.2024 | 53 | 53 | 52 |
| 24.04.2024 | 54 | 56 | 53 |
| 23.04.2024 | 56 | 57 | 56 |
| 22.04.2024 | 57 | 58 | 56 |
| 21.04.2024 | 55 | 57 | 54 |
© Bayerisches Landesamt für Umwelt 2024