
- Start >
- Rivers >
- Waterlevel >
- Isar >
- Wasserburg >
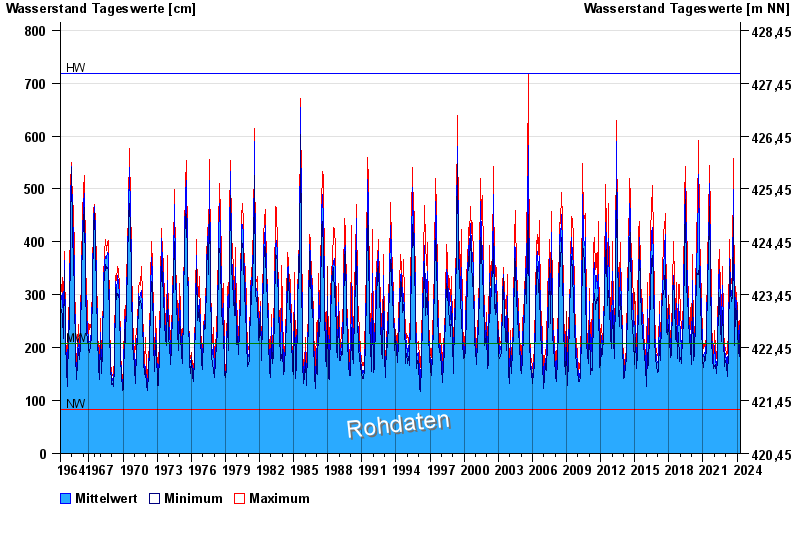
- Chart of total period

Chart of total period Wasserburg / Inn
Waterlevel from 01.07.1964 to 19.04.2024
| Date | Mean value [cm] | Maximum [cm] | Minimum [cm] |
|---|---|---|---|
| 19.04.2024 | 239 | 240 | 239 |
| 18.04.2024 | 251 | 257 | 240 |
| 17.04.2024 | 264 | 277 | 252 |
| 16.04.2024 | 275 | 280 | 268 |
| 15.04.2024 | 263 | 277 | 229 |
| 14.04.2024 | 217 | 229 | 211 |
| 13.04.2024 | 214 | 222 | 206 |
© Bayerisches Landesamt für Umwelt 2024