
- Start >
- Rivers >
- Waterlevel >
- Isar >
- Odelzhausen >
- Chart of year

Chart of year Odelzhausen / Glonn
Waterlevel from 01.01.2024 to 31.12.2024
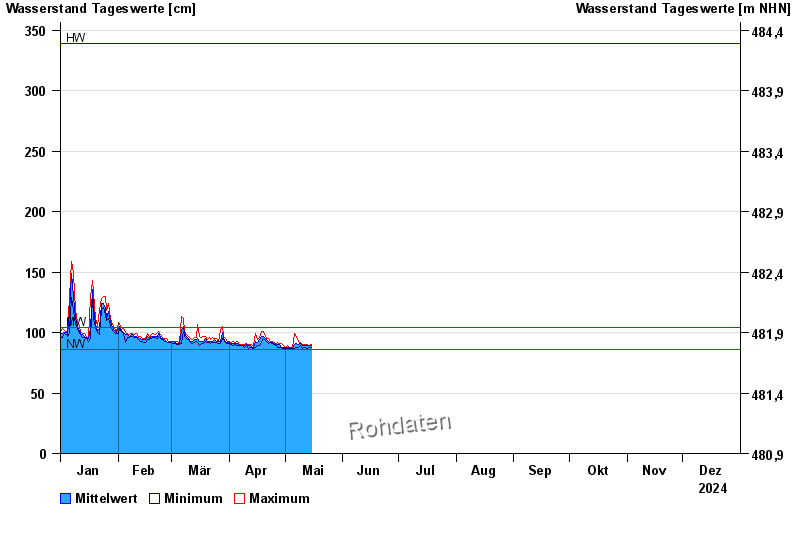
| Date | Mean value [cm] | Maximum [cm] | Minimum [cm] |
|---|---|---|---|
| 22.05.2024 | 98 | 98 | 97 |
| 21.05.2024 | 93 | 97 | 92 |
| 20.05.2024 | 97 | 101 | 93 |
| 19.05.2024 | 135 | 174 | 101 |
| 18.05.2024 | 91 | 137 | 87 |
| 17.05.2024 | 90 | 93 | 89 |
| 16.05.2024 | 88 | 89 | 87 |
© Bayerisches Landesamt für Umwelt 2024