
- Start >
- Rivers >
- Waterlevel >
- Isar >
- Odelzhausen >
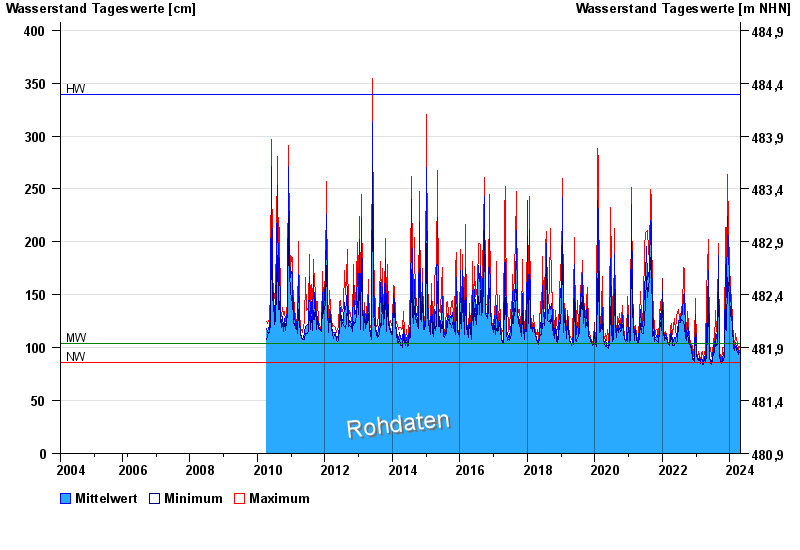
- Chart of total period

Chart of total period Odelzhausen / Glonn
Waterlevel from 02.03.2004 to 24.04.2024
| Date | Mean value [cm] | Maximum [cm] | Minimum [cm] |
|---|---|---|---|
| 24.04.2024 | 92 | 93 | 91 |
| 23.04.2024 | 92 | 93 | 92 |
| 22.04.2024 | 93 | 95 | 91 |
| 21.04.2024 | 94 | 95 | 93 |
| 20.04.2024 | 96 | 98 | 94 |
| 19.04.2024 | 97 | 101 | 95 |
| 18.04.2024 | 97 | 101 | 92 |
© Bayerisches Landesamt für Umwelt 2024