
- Start >
- Rivers >
- Waterlevel >
- Isar >
- Odelzhausen >
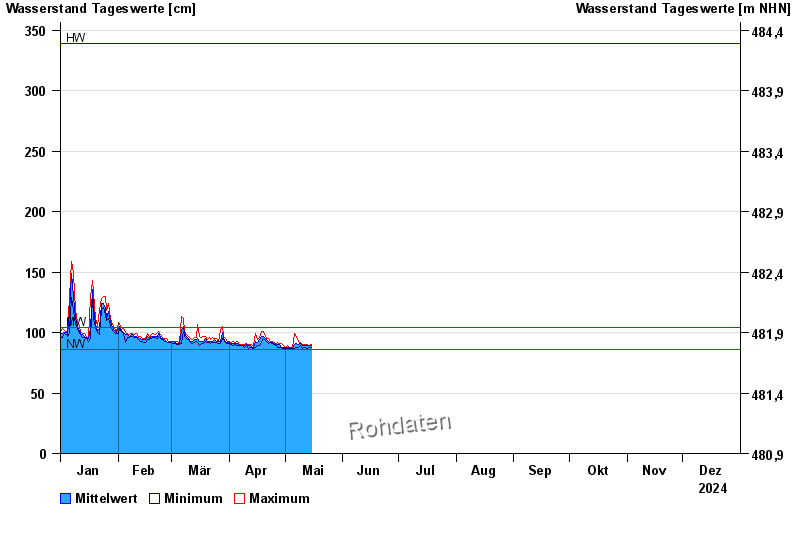
- Chart of year

Chart of year Odelzhausen / Glonn
Waterlevel from 01.01.2024 to 31.12.2024
| Date | Mean value [cm] | Maximum [cm] | Minimum [cm] |
|---|---|---|---|
| 16.05.2024 | 88 | 89 | 88 |
| 15.05.2024 | 89 | 90 | 88 |
| 14.05.2024 | 89 | 89 | 88 |
| 13.05.2024 | 89 | 90 | 87 |
| 12.05.2024 | 89 | 90 | 88 |
| 11.05.2024 | 89 | 90 | 88 |
| 10.05.2024 | 89 | 90 | 87 |
© Bayerisches Landesamt für Umwelt 2024