
- Start >
- Rivers >
- Waterlevel >
- Inn >
- Schwöbbrücke >
- Chart of total period

Chart of total period Schwöbbrücke / Königsseer Ache
Waterlevel from 01.11.1969 to 27.04.2024
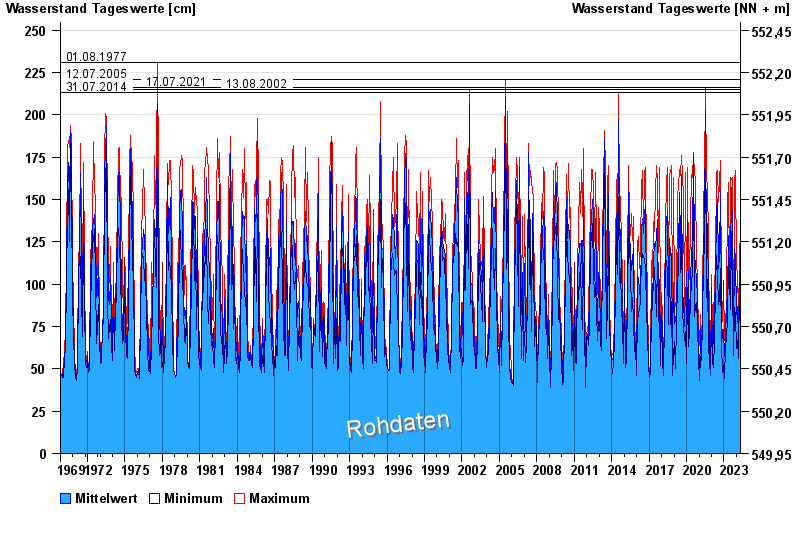
- 01.08.1977 Wasserstand: 231 cm
- 12.07.2005 Wasserstand: 221 cm
- 17.07.2021 Wasserstand: 216 cm
- 13.08.2002 Wasserstand: 215 cm
- 31.07.2014 Wasserstand: 213 cm
| Date | Mean value [cm] | Maximum [cm] | Minimum [cm] |
|---|---|---|---|
| 27.04.2024 | 58 | 58 | 58 |
| 26.04.2024 | 58 | 58 | 57 |
| 25.04.2024 | 58 | 58 | 58 |
| 24.04.2024 | 58 | 59 | 58 |
| 23.04.2024 | 58 | 59 | 57 |
| 22.04.2024 | 59 | 71 | 57 |
| 21.04.2024 | 71 | 72 | 70 |
© Bayerisches Landesamt für Umwelt 2024