
- Start >
- Rivers >
- Waterlevel >
- Inn >
- Schwöbbrücke >
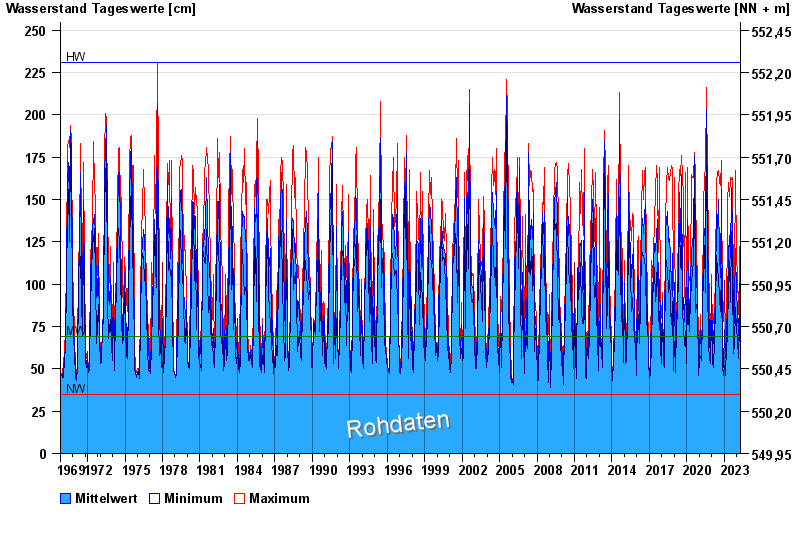
- Chart of total period

Chart of total period Schwöbbrücke / Königsseer Ache
Waterlevel from 01.11.1969 to 18.04.2024
| Date | Mean value [cm] | Maximum [cm] | Minimum [cm] |
|---|---|---|---|
| 18.04.2024 | 83 | 83 | 82 |
| 17.04.2024 | 76 | 83 | 74 |
| 16.04.2024 | 108 | 136 | 74 |
| 15.04.2024 | 102 | 104 | 100 |
| 14.04.2024 | 95 | 102 | 88 |
| 13.04.2024 | 91 | 94 | 86 |
| 12.04.2024 | 83 | 90 | 68 |
© Bayerisches Landesamt für Umwelt 2024