
- Start >
- Rivers >
- Waterlevel >
- Inn >
- Mühldorf >
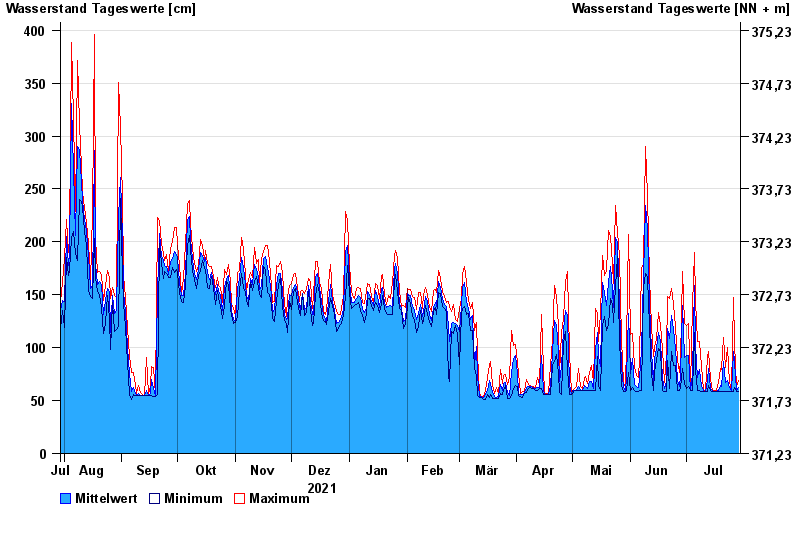
- Chart of year

Chart of year Mühldorf / Inn
Waterlevel from 30.07.2021 to 29.07.2022
- 24.08.2005 Wasserstand: 799 cm
- 07.08.1985 Wasserstand: 766 cm
- 03.06.2013 Wasserstand: 708 cm
- 20.07.1981 Wasserstand: 677 cm
- 22.05.1999 Wasserstand: 662 cm
| Date | Mean value [cm] | Maximum [cm] | Minimum [cm] |
|---|---|---|---|
| 29.07.2022 | 62 | 69 | 59 |
| 28.07.2022 | 60 | 63 | 59 |
| 27.07.2022 | 87 | 104 | 62 |
| 26.07.2022 | 96 | 147 | 59 |
| 25.07.2022 | 59 | 60 | 59 |
| 24.07.2022 | 62 | 67 | 59 |
| 23.07.2022 | 69 | 100 | 59 |
© Bayerisches Landesamt für Umwelt 2024