
- Start >
- Rivers >
- Waterlevel >
- Inn >
- Mühldorf >
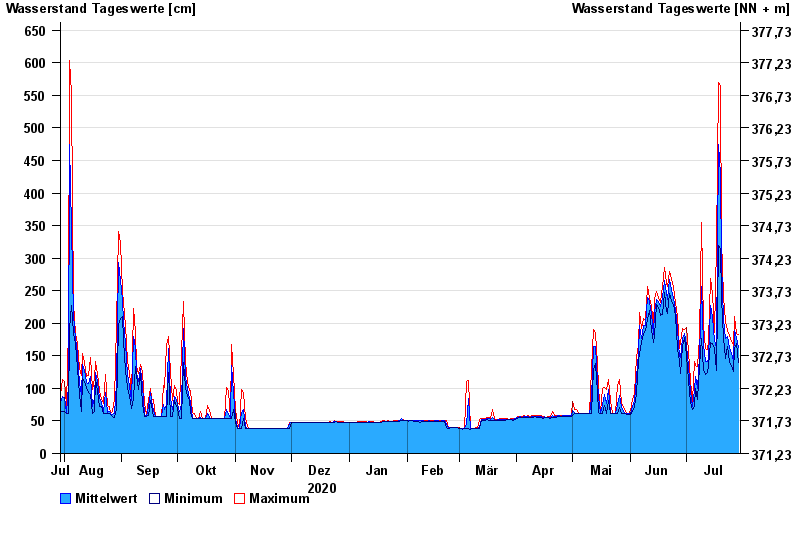
- Chart of year

Chart of year Mühldorf / Inn
Waterlevel from 30.07.2020 to 29.07.2021
- 24.08.2005 Wasserstand: 799 cm
- 07.08.1985 Wasserstand: 766 cm
- 03.06.2013 Wasserstand: 708 cm
- 20.07.1981 Wasserstand: 677 cm
- 22.05.1999 Wasserstand: 662 cm
| Date | Mean value [cm] | Maximum [cm] | Minimum [cm] |
|---|---|---|---|
| 29.07.2021 | 163 | 183 | 140 |
| 28.07.2021 | 178 | 184 | 169 |
| 27.07.2021 | 189 | 210 | 161 |
| 26.07.2021 | 141 | 166 | 126 |
| 25.07.2021 | 153 | 172 | 135 |
| 24.07.2021 | 163 | 181 | 139 |
| 23.07.2021 | 180 | 189 | 165 |
© Bayerisches Landesamt für Umwelt 2024