
- Start >
- Rivers >
- Waterlevel >
- Iller - Lech - Bodensee >
- Pfronten Ried >
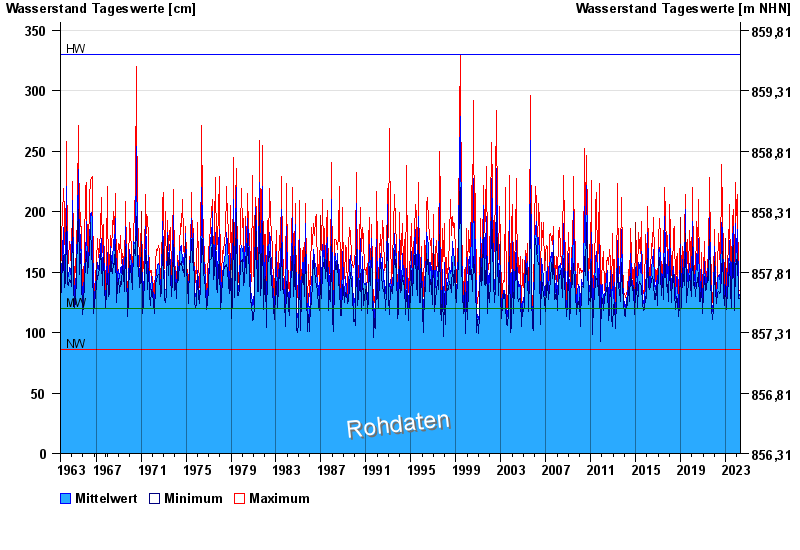
- Chart of total period

Chart of total period Pfronten Ried / Vils
Waterlevel from 01.11.1963 to 26.04.2024
| Date | Mean value [cm] | Maximum [cm] | Minimum [cm] |
|---|---|---|---|
| 26.04.2024 | 115 | 123 | 110 |
| 25.04.2024 | 118 | 127 | 108 |
| 24.04.2024 | 118 | 129 | 106 |
| 23.04.2024 | 119 | 125 | 113 |
| 22.04.2024 | 121 | 123 | 113 |
| 21.04.2024 | 122 | 125 | 118 |
| 20.04.2024 | 124 | 129 | 121 |
© Bayerisches Landesamt für Umwelt 2024