
- Start >
- Rivers >
- Waterlevel >
- Iller - Lech - Bodensee >
- Pfronten Ried >
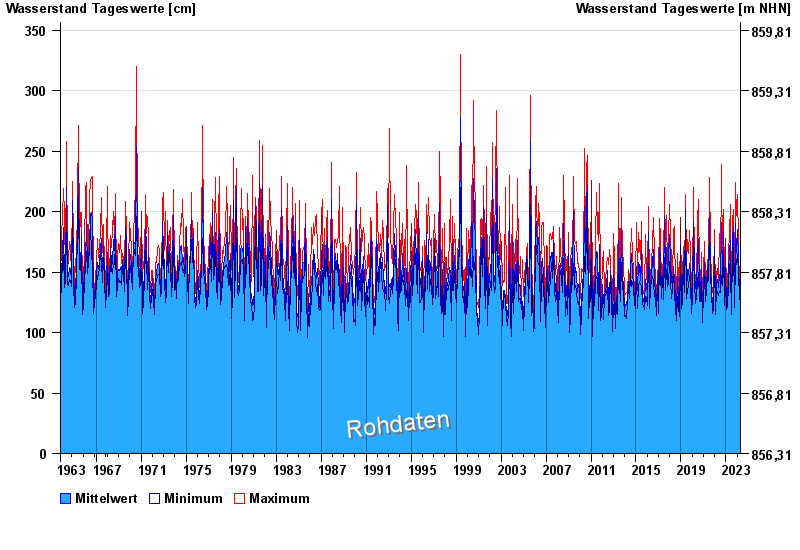
- Chart of total period

Chart of total period Pfronten Ried / Vils
Waterlevel from 01.11.1963 to 16.04.2024
| Date | Mean value [cm] | Maximum [cm] | Minimum [cm] |
|---|---|---|---|
| 16.04.2024 | 132 | 135 | 130 |
| 15.04.2024 | 128 | 132 | 122 |
| 14.04.2024 | 125 | 129 | 120 |
| 13.04.2024 | 123 | 126 | 119 |
| 12.04.2024 | 123 | 126 | 118 |
| 11.04.2024 | 125 | 127 | 123 |
| 10.04.2024 | 130 | 131 | 125 |
© Bayerisches Landesamt für Umwelt 2024