
- Start >
- Rivers >
- Waterlevel >
- Iller - Lech - Bodensee >
- Fleinhausen >
- Chart of year

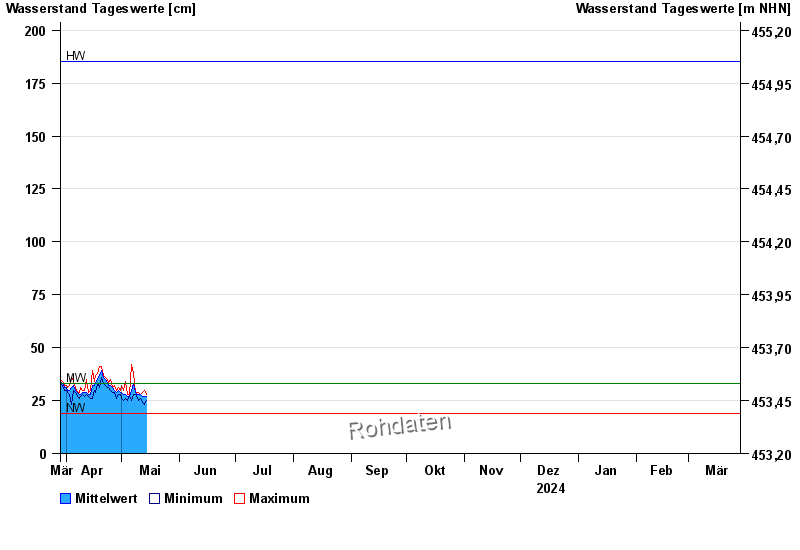
Chart of year Fleinhausen / Zusam
Waterlevel from 29.03.2024 to 28.03.2025
| Date | Mean value [cm] | Maximum [cm] | Minimum [cm] |
|---|---|---|---|
| 08.06.2024 | 41 | 41 | 41 |
| 07.06.2024 | 41 | 43 | 39 |
| 06.06.2024 | 43 | 46 | 41 |
| 05.06.2024 | 50 | 56 | 46 |
| 04.06.2024 | 74 | 106 | 56 |
| 03.06.2024 | 148 | 175 | 107 |
| 02.06.2024 | 196 | 219 | 176 |
© Bayerisches Landesamt für Umwelt 2024