
- Start >
- Rivers >
- Waterlevel >
- Iller - Lech - Bodensee >
- Fleinhausen >
- Chart of total period

Chart of total period Fleinhausen / Zusam
Waterlevel from 01.11.1979 to 24.04.2024
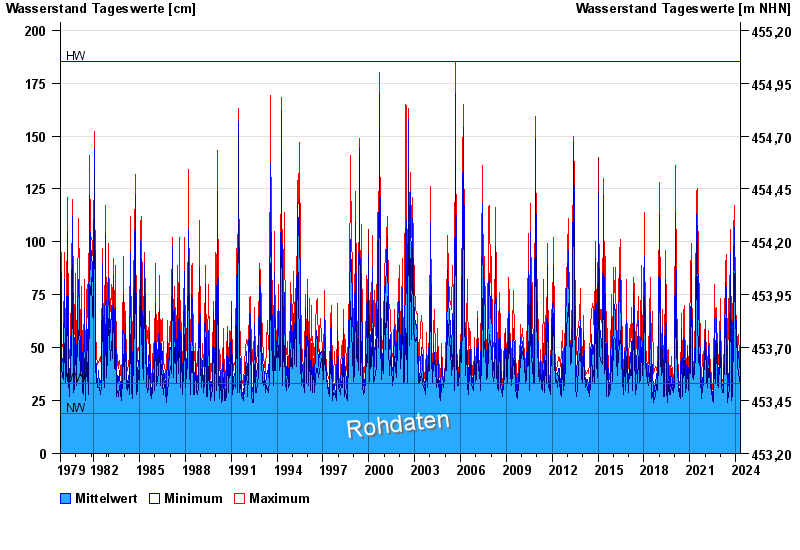
| Date | Mean value [cm] | Maximum [cm] | Minimum [cm] |
|---|---|---|---|
| 24.04.2024 | 32 | 32 | 31 |
| 23.04.2024 | 33 | 35 | 31 |
| 22.04.2024 | 35 | 36 | 32 |
| 21.04.2024 | 36 | 37 | 33 |
| 20.04.2024 | 39 | 41 | 36 |
| 19.04.2024 | 37 | 41 | 31 |
| 18.04.2024 | 35 | 38 | 33 |
© Bayerisches Landesamt für Umwelt 2024