
- Start >
- Rivers >
- Waterlevel >
- Iller - Lech - Bodensee >
- Arzberg >
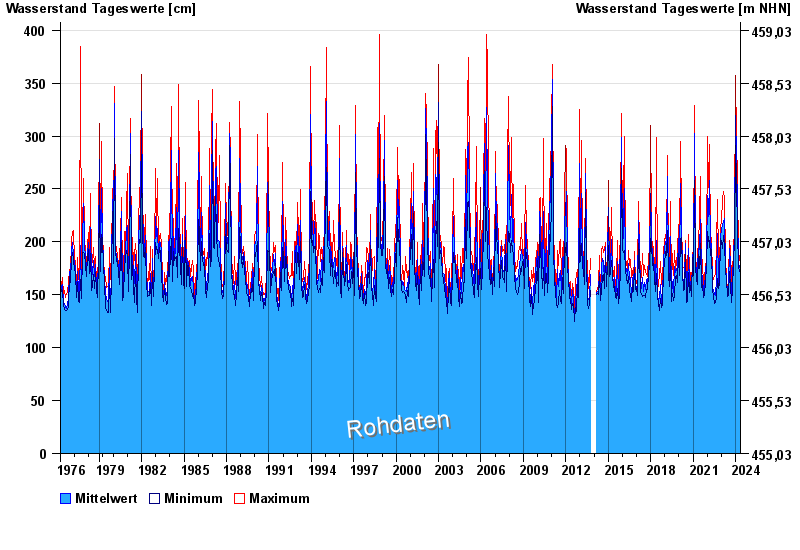
- Chart of total period

Chart of total period Arzberg / Röslau
Waterlevel from 05.04.1976 to 09.05.2024
| Date | Mean value [cm] | Maximum [cm] | Minimum [cm] |
|---|---|---|---|
| 09.05.2024 | 166 | 166 | 165 |
| 08.05.2024 | 169 | 176 | 165 |
| 07.05.2024 | 174 | 177 | 170 |
| 06.05.2024 | 162 | 172 | 158 |
| 05.05.2024 | 158 | 169 | 154 |
| 04.05.2024 | 155 | 155 | 154 |
| 03.05.2024 | 157 | 162 | 155 |
© Bayerisches Landesamt für Umwelt 2024