
- Start >
- Rivers >
- Waterlevel >
- Iller - Lech - Bodensee >
- Arzberg >
- Chart of total period

Chart of total period Arzberg / Röslau
Waterlevel from 05.04.1976 to 23.04.2024
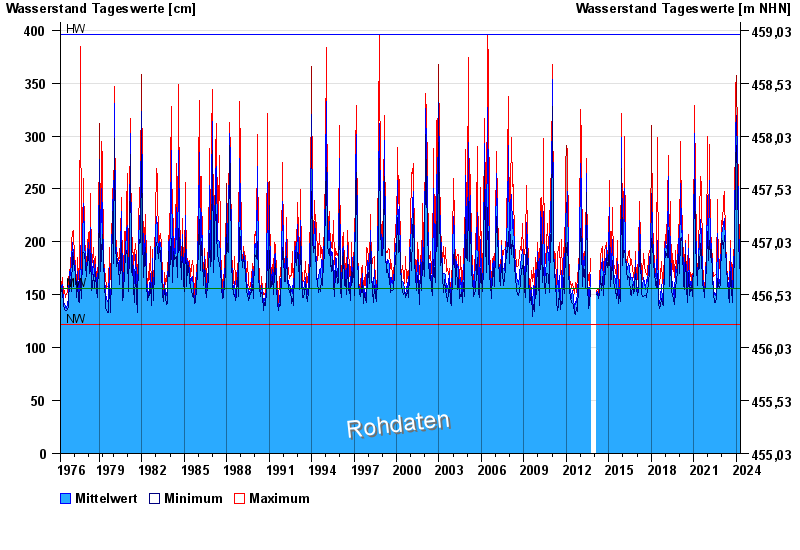
| Date | Mean value [cm] | Maximum [cm] | Minimum [cm] |
|---|---|---|---|
| 23.04.2024 | 173 | 180 | 169 |
| 22.04.2024 | 176 | 186 | 172 |
| 21.04.2024 | 177 | 187 | 172 |
| 20.04.2024 | 175 | 178 | 168 |
| 19.04.2024 | 159 | 168 | 156 |
| 18.04.2024 | 158 | 159 | 157 |
| 17.04.2024 | 163 | 166 | 159 |
© Bayerisches Landesamt für Umwelt 2024