
- Start >
- Rivers >
- Waterlevel >
- Oberer Main - Elbe >
- Schenkenau >
- Chart of total period

Chart of total period Schenkenau / Itz
Waterlevel from 31.05.1965 to 26.04.2024
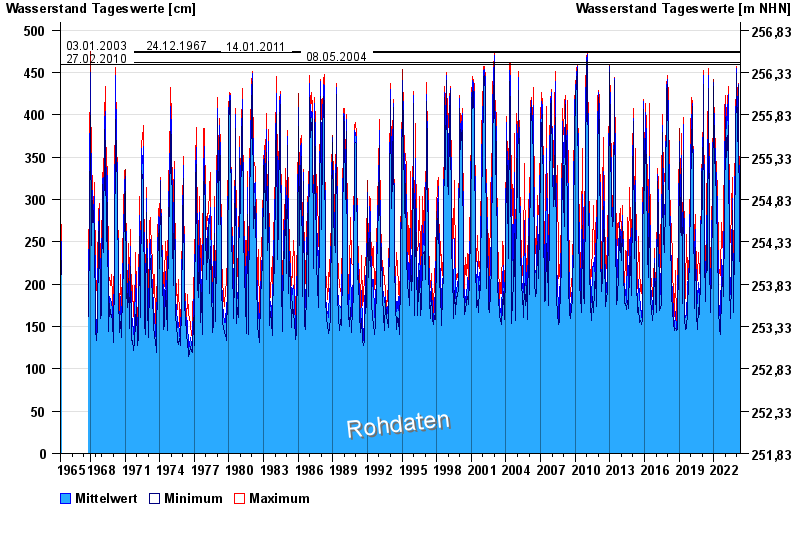
- 03.01.2003 Wasserstand: 475 cm
- 24.12.1967 Wasserstand: 475 cm
- 14.01.2011 Wasserstand: 474 cm
- 08.05.2004 Wasserstand: 462 cm
- 27.02.2010 Wasserstand: 460 cm
| Date | Mean value [cm] | Maximum [cm] | Minimum [cm] |
|---|---|---|---|
| 26.04.2024 | 217 | 221 | 213 |
| 25.04.2024 | 219 | 223 | 215 |
| 24.04.2024 | 218 | 224 | 214 |
| 23.04.2024 | 227 | 235 | 221 |
| 22.04.2024 | 244 | 260 | 233 |
| 21.04.2024 | 266 | 277 | 247 |
| 20.04.2024 | 259 | 278 | 245 |
© Bayerisches Landesamt für Umwelt 2024