
- Start >
- Rivers >
- Waterlevel >
- Oberer Main - Elbe >
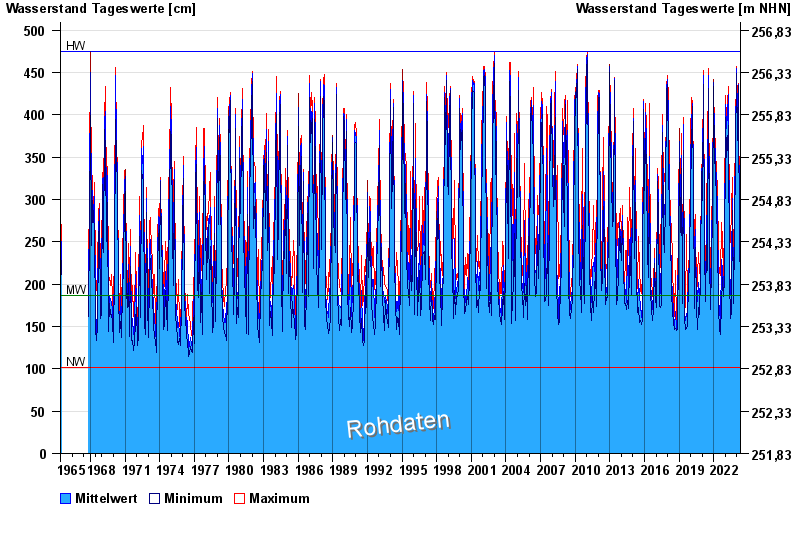
- Schenkenau >
- Chart of total period

Chart of total period Schenkenau / Itz
Waterlevel from 31.05.1965 to 25.04.2024
| Date | Mean value [cm] | Maximum [cm] | Minimum [cm] |
|---|---|---|---|
| 25.04.2024 | 218 | 220 | 215 |
| 24.04.2024 | 218 | 224 | 214 |
| 23.04.2024 | 227 | 235 | 221 |
| 22.04.2024 | 244 | 260 | 233 |
| 21.04.2024 | 266 | 277 | 247 |
| 20.04.2024 | 259 | 278 | 245 |
| 19.04.2024 | 202 | 258 | 188 |
© Bayerisches Landesamt für Umwelt 2024