
- Start >
- Rivers >
- Waterlevel >
- Oberer Main - Elbe >
- Grafenwöhr >
- Chart of year

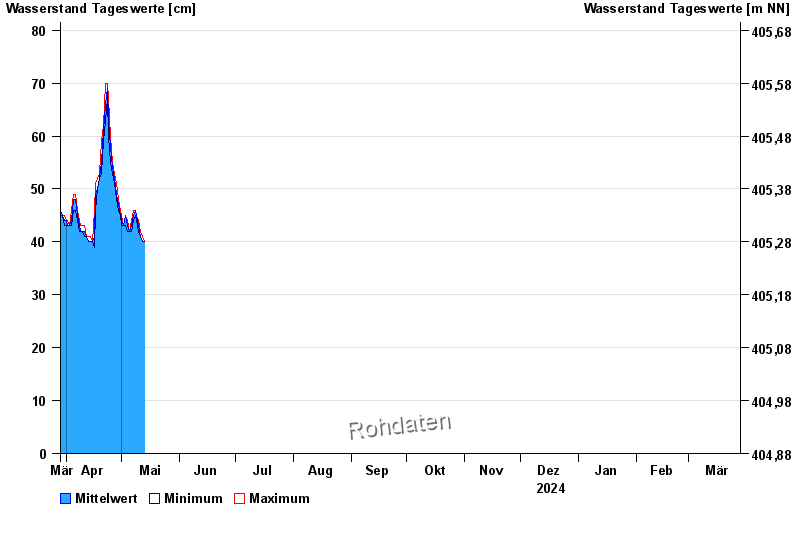
Chart of year Grafenwöhr / Creußen
Waterlevel from 29.03.2024 to 28.03.2025
| Date | Mean value [cm] | Maximum [cm] | Minimum [cm] |
|---|---|---|---|
| 05.06.2024 | 54 | 55 | 53 |
| 04.06.2024 | 56 | 58 | 55 |
| 03.06.2024 | 59 | 59 | 58 |
| 02.06.2024 | 58 | 59 | 57 |
| 01.06.2024 | 54 | 88 | 51 |
| 31.05.2024 | 50 | 51 | 49 |
| 30.05.2024 | 48 | 49 | 46 |
© Bayerisches Landesamt für Umwelt 2024