
- Start >
- Rivers >
- Waterlevel >
- Oberer Main - Elbe >
- Grafenwöhr >
- Chart of year

Chart of year Grafenwöhr / Creußen
Waterlevel from 29.03.2024 to 28.03.2025
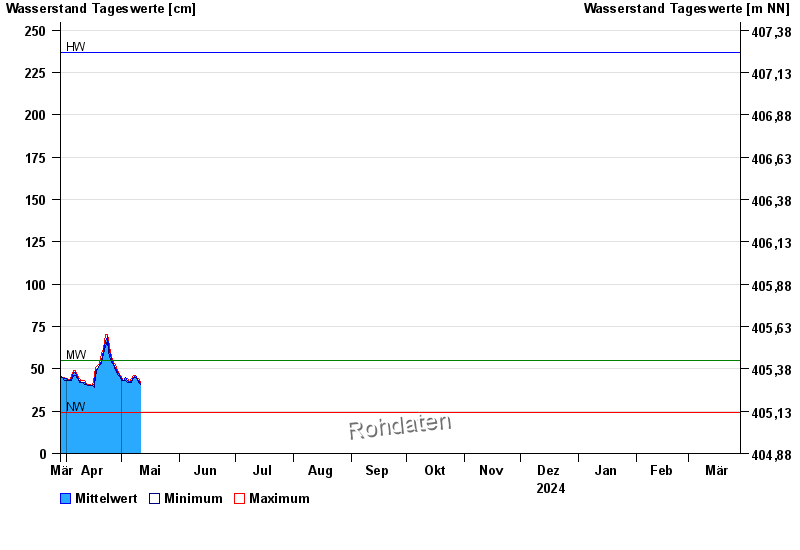
| Date | Mean value [cm] | Maximum [cm] | Minimum [cm] |
|---|---|---|---|
| 23.05.2024 | 56 | 58 | 54 |
| 22.05.2024 | 49 | 54 | 44 |
| 21.05.2024 | 39 | 47 | 38 |
| 20.05.2024 | 39 | 40 | 38 |
| 19.05.2024 | 40 | 40 | 40 |
| 18.05.2024 | 39 | 40 | 38 |
| 17.05.2024 | 38 | 40 | 37 |
© Bayerisches Landesamt für Umwelt 2024