
- Start >
- Rivers >
- Waterlevel >
- Oberer Main - Elbe >
- Erlabrück >
- Chart of total period

Chart of total period Erlabrück / Rodach
Waterlevel from 03.03.1969 to 07.05.2024
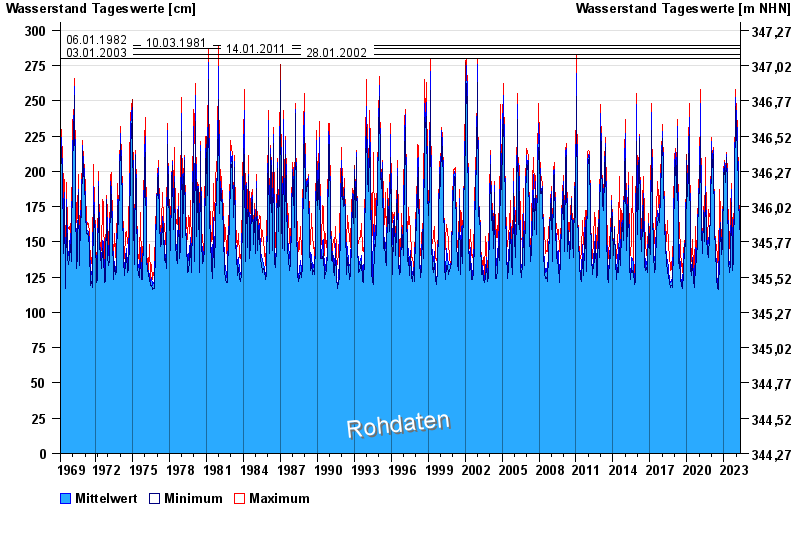
- 06.01.1982 Wasserstand: 289 cm
- 10.03.1981 Wasserstand: 287 cm
- 14.01.2011 Wasserstand: 283 cm
- 03.01.2003 Wasserstand: 280 cm
- 28.01.2002 Wasserstand: 280 cm
| Date | Mean value [cm] | Maximum [cm] | Minimum [cm] |
|---|---|---|---|
| 07.05.2024 | 145 | 149 | 141 |
| 06.05.2024 | 139 | 142 | 138 |
| 05.05.2024 | 139 | 141 | 137 |
| 04.05.2024 | 138 | 139 | 134 |
| 03.05.2024 | 141 | 145 | 139 |
| 02.05.2024 | 141 | 142 | 139 |
| 01.05.2024 | 142 | 142 | 141 |
© Bayerisches Landesamt für Umwelt 2024