
- Start >
- Rivers >
- Waterlevel >
- Oberer Main - Elbe >
- Erlabrück >
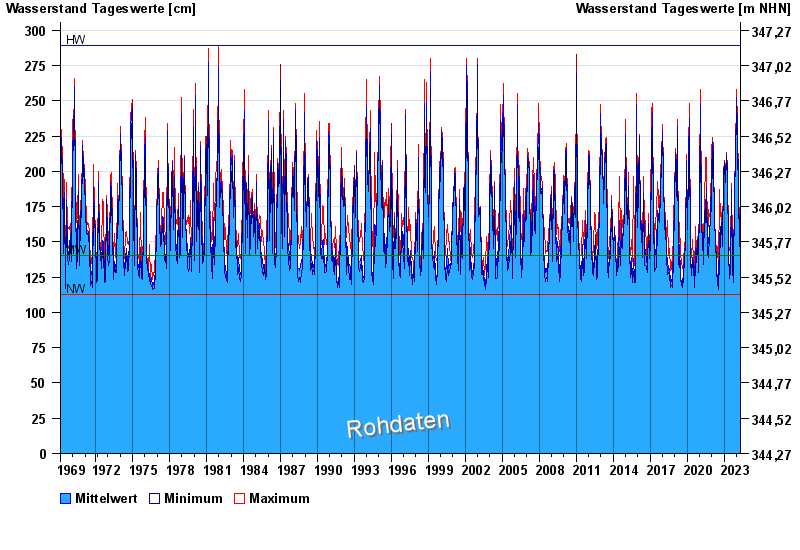
- Chart of total period

Chart of total period Erlabrück / Rodach
Waterlevel from 03.03.1969 to 27.04.2024
| Date | Mean value [cm] | Maximum [cm] | Minimum [cm] |
|---|---|---|---|
| 27.04.2024 | 152 | 153 | 147 |
| 26.04.2024 | 155 | 157 | 153 |
| 25.04.2024 | 159 | 161 | 158 |
| 24.04.2024 | 158 | 159 | 157 |
| 23.04.2024 | 160 | 160 | 159 |
| 22.04.2024 | 159 | 160 | 159 |
| 21.04.2024 | 158 | 160 | 157 |
© Bayerisches Landesamt für Umwelt 2024