
- Start >
- Rivers >
- Waterlevel >
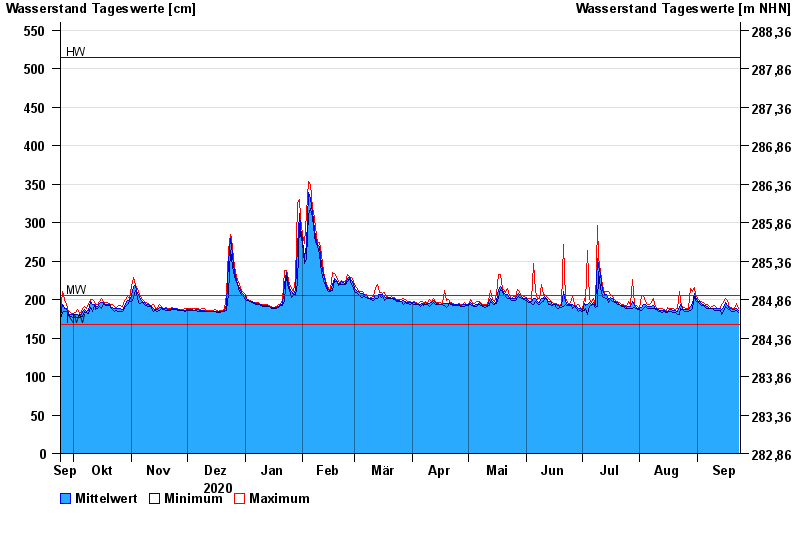
- Oberer Main - Elbe >
- Coburg >
- Chart of year

Chart of year Coburg / Itz
Waterlevel from 24.09.2020 to 23.09.2021
| Date | Mean value [cm] | Maximum [cm] | Minimum [cm] |
|---|---|---|---|
| 23.09.2021 | 186 | 188 | 183 |
| 22.09.2021 | 188 | 195 | 186 |
| 21.09.2021 | 187 | 188 | 185 |
| 20.09.2021 | 187 | 189 | 184 |
| 19.09.2021 | 188 | 190 | 185 |
| 18.09.2021 | 189 | 190 | 187 |
| 17.09.2021 | 192 | 199 | 189 |
© Bayerisches Landesamt für Umwelt 2024