
- Start >
- Rivers >
- Waterlevel >
- Oberer Main - Elbe >
- Coburg >
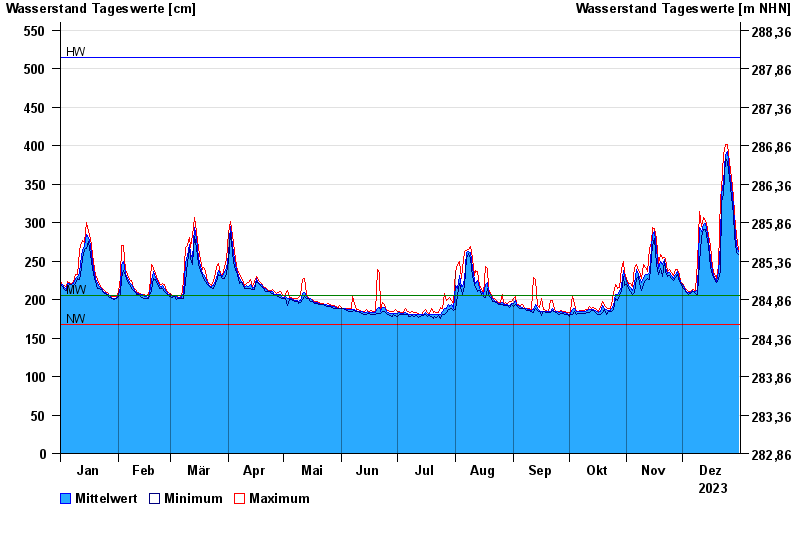
- Chart of year

Chart of year Coburg / Itz
Waterlevel from 01.01.2023 to 31.12.2023
| Date | Mean value [cm] | Maximum [cm] | Minimum [cm] |
|---|---|---|---|
| 31.12.2023 | 262 | 265 | 258 |
| 30.12.2023 | 270 | 283 | 261 |
| 29.12.2023 | 299 | 310 | 283 |
| 28.12.2023 | 321 | 334 | 310 |
| 27.12.2023 | 348 | 359 | 334 |
| 26.12.2023 | 367 | 378 | 359 |
| 25.12.2023 | 392 | 401 | 378 |
© Bayerisches Landesamt für Umwelt 2024