
- Start >
- Rivers >
- Waterlevel >
- Bayern >
- Weilheim >
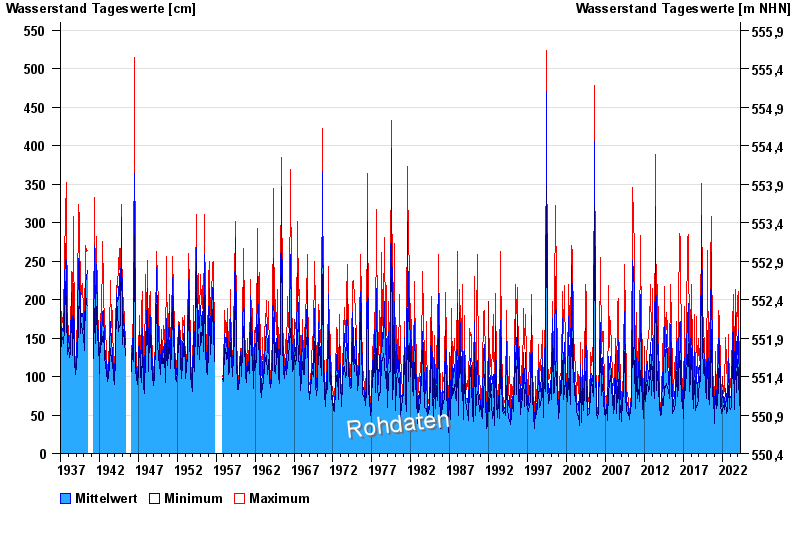
- Chart of total period

Chart of total period Weilheim / Ammer
Waterlevel from 04.01.1937 to 30.04.2024
| Date | Mean value [cm] | Maximum [cm] | Minimum [cm] |
|---|---|---|---|
| 30.04.2024 | 65 | 66 | 62 |
| 29.04.2024 | 64 | 71 | 59 |
| 28.04.2024 | 63 | 71 | 60 |
| 27.04.2024 | 55 | 58 | 53 |
| 26.04.2024 | 54 | 56 | 52 |
| 25.04.2024 | 57 | 60 | 55 |
| 24.04.2024 | 55 | 59 | 54 |
© Bayerisches Landesamt für Umwelt 2024