
- Start >
- Rivers >
- Waterlevel >
- Bayern >
- Weiden >
- Chart of month

Chart of month Weiden / Waldnaab
Waterlevel from 01.11.2025 to 30.11.2025
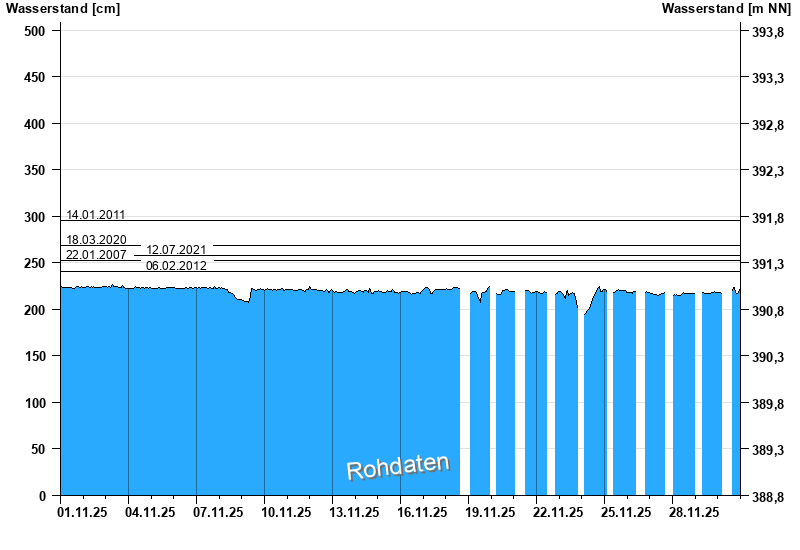
- 14.01.2011 Wasserstand: 296 cm
- 18.03.2020 Wasserstand: 269 cm
- 12.07.2021 Wasserstand: 258 cm
- 22.01.2007 Wasserstand: 253 cm
- 06.02.2012 Wasserstand: 241 cm
| Date | Waterlevel [cm] |
|---|---|
| 30.11.2025 23:45 | 221 |
| 30.11.2025 23:30 | 221 |
| 30.11.2025 23:15 | 221 |
| 30.11.2025 23:00 | 220 |
| 30.11.2025 22:45 | 219 |
| 30.11.2025 22:30 | 219 |
| 30.11.2025 22:15 | 218 |
© Bayerisches Landesamt für Umwelt 2025