
- Start >
- Rivers >
- Waterlevel >
- Bayern >
- Weiboldshausen >
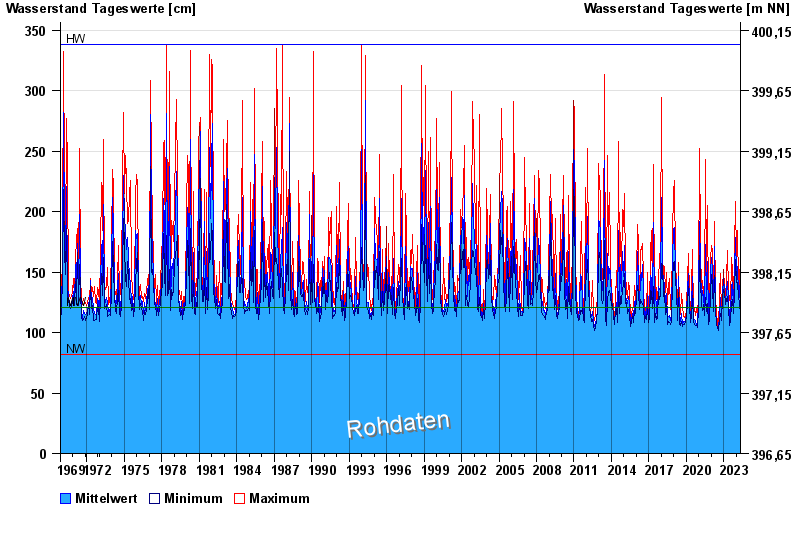
- Chart of total period

Chart of total period Weiboldshausen / Felchbach
Waterlevel from 18.11.1969 to 02.05.2024
note
Wasserstand und Abfluss wird zeitweise durch Biberdamm beeinflusst.
| Date | Mean value [cm] | Maximum [cm] | Minimum [cm] |
|---|---|---|---|
| 02.05.2024 | 107 | 107 | 107 |
| 01.05.2024 | 107 | 108 | 107 |
| 30.04.2024 | 107 | 108 | 107 |
| 29.04.2024 | 108 | 109 | 105 |
| 28.04.2024 | 109 | 109 | 109 |
| 27.04.2024 | 110 | 110 | 109 |
| 26.04.2024 | 110 | 110 | 110 |
© Bayerisches Landesamt für Umwelt 2024