
- Start >
- Rivers >
- Waterlevel >
- Bayern >
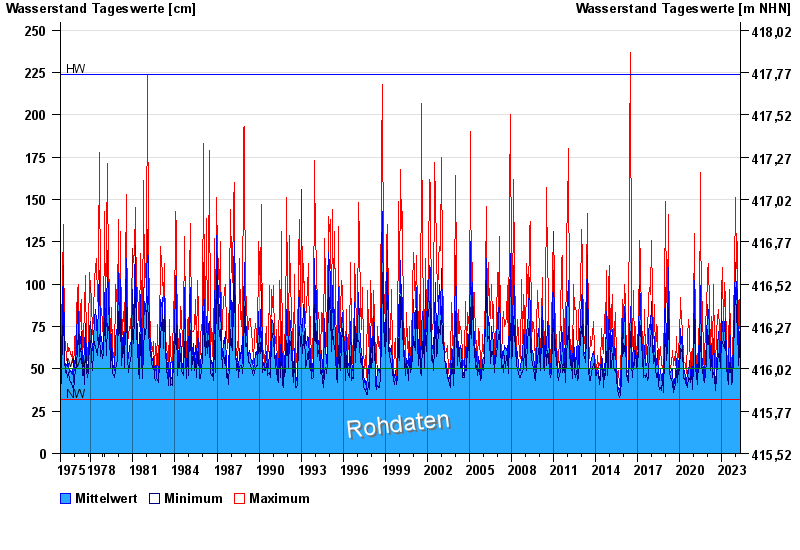
- Viechtach Reibenmühle >
- Chart of total period

Chart of total period Viechtach Reibenmühle / Aitnach
Waterlevel from 01.11.1975 to 09.05.2024
| Date | Mean value [cm] | Maximum [cm] | Minimum [cm] |
|---|---|---|---|
| 09.05.2024 | 45 | 45 | 45 |
| 08.05.2024 | 45 | 46 | 45 |
| 07.05.2024 | 49 | 56 | 46 |
| 06.05.2024 | 45 | 49 | 44 |
| 05.05.2024 | 44 | 46 | 44 |
| 04.05.2024 | 44 | 45 | 44 |
| 03.05.2024 | 44 | 45 | 44 |
© Bayerisches Landesamt für Umwelt 2024